


Stock Market Retest of the High?
Stock-Markets / Stock Market 2021 Sep 27, 2021 - 08:03 PM GMTBy: Andre_Gratian

Current Position of the Market
SPX Long-term trend: There is some evidence that we are still in the bull market which started in 2009 and which could continue until major cycles take over, and it ends. The 4550 projection which had been in effect since the March 2020 low has now been reached, but there is still no sign of a major top.
SPX Intermediate trend: A retest of the high is underway.
Analysis of the short-term trend is done daily with the help of hourly charts. They are important adjuncts to the analysis of daily and weekly charts which determine longer market trends.
Retest of the High?
Cycles: Looking ahead!
7-yr cycle – Last lows: 2009-2016. Next low: ~2023
Market Analysis (Charts, courtesy of StockCharts)
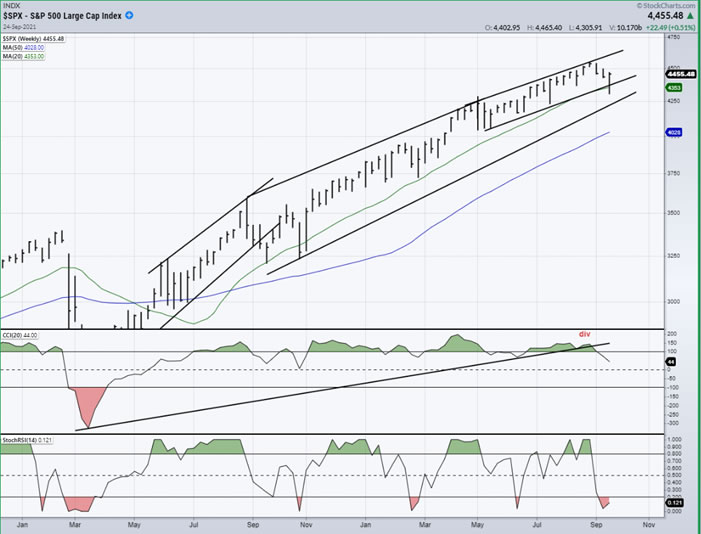
SPX weekly
It may be a little early to take a look at the weekly chart. And then, perhaps it’s not! You know what they say about the early bird! There are a few things worth noting. First, last week was the deepest pullback by SPX in a year. And second, it created the deepest contraction in the CCI for the same time period, after that indicator exhibited some negative divergence. The onus is now on that index to show that it was only a fluke, and that it can now go on its merry way making new all-time highs ad nauseam. Of course, we know that this is not the way the market works, so it behooves us to be attentive to a change of trend, especially since we are on the lookout for any sign that the 7-year cycle, due to make its low in 2023, is beginning to exert pressure on prices. The bottoming of the 7-year cycle could bring about a correction on the order of the one which occurred early last year. And, more immediately, with a 20-week cycle low due in November (according to a Hurst cycle analyst), we should look for signs that this cycle is about to create an even deeper near-term correction.
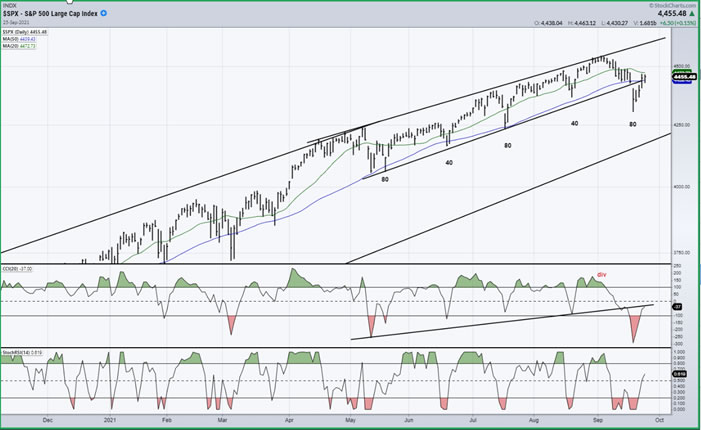
SPX daily chart
Below, I show in more detail that SPX recently displayed more weakness than at any other time on this chart. By drawing a channel around the price fluctuations since last May, we can see that the lower channel line was deeply penetrated, clearly demonstrating that the recent weakness was the greatest price weakness since May and beyond. So far, although we halted the decline and a good rally followed, there is still a long way to go to regain the price loss which occurred.
Each short-term low is identified as either a 40 or 80-day low. This refers to Hurst cycles, but these numbers are misleading since the 40-day Hurst cycle currently averages 33.2 days and the 80-day cycle, 65.5 days. What is also worth noting is that for the first time on this chart, a previous short-term low has been broken. This could be warning of a trend change because, as I mentioned in last week’s newsletter, the simplest definition of an uptrend is a series of higher highs and higher lows. If the current pattern is reversed with a lower low followed by a lower high, then we may be starting a downtrend.
The current 80-day cycle clearly bottomed right on schedule last Monday at 4306, with a close on Friday at 4455. A good rally so far, but still well short of the former high of 4546. However, the cycle is still in its early phase, and it has plenty of time to challenge the former high and avoid making a lower high. Do we have any way to evaluate its chances of doing so? According to the P&F chart, there is a potential count tentatively suggesting that this rally could carry back to the former high, but no higher. It’s too soon to place any kind of credibility on this projection until some degree of confirmation is attained.
One more point to show that this was the weakest short-term cycle in some time. This is the first time since March that the index closed decisively below the 50-dma. Although it did manage to close back above it at the end of the week, it has more convincing to do to prove that it remains in a long-term uptrend.
-
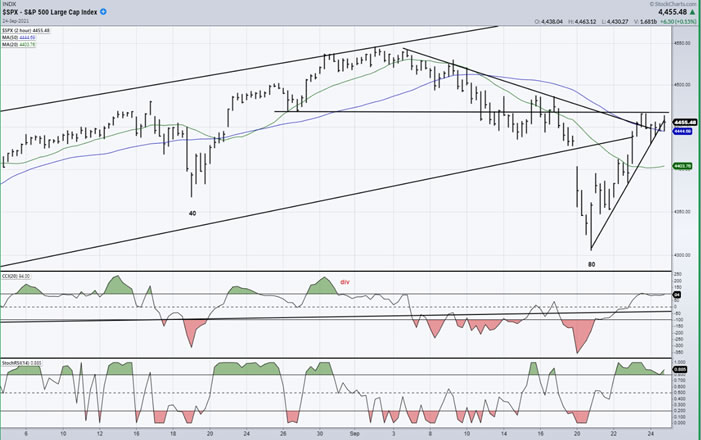
- SPX hourly chart
- The SPX 2-hour chart demonstrates more vividly the amount by which the last short-term low was broken. Since then, the index rallied, closed the downside-gap, and continued higher until it got inside the resistance band where it stopped and pulled back in a small consolidation pattern. So far, the new uptrend seems normal with no real weakness showing in price or in the oscillators. The advance was stopped by the downtrend line which was slightly surpassed but not completely overcome. Same with the 50-hr MA. The 4465 level, where the rally stopped was also the projection target generated by the last consolidation phase.
- Another reason for the index to take a breather at this time is to see if congress can agree on raising the debt ceiling with the deadline for doing this fast approaching. Everything considered, the consolidation at this level could be extended into early next week and, if not much more weakness occurs, the uptrend should continue. We need to see how we proceed from here.
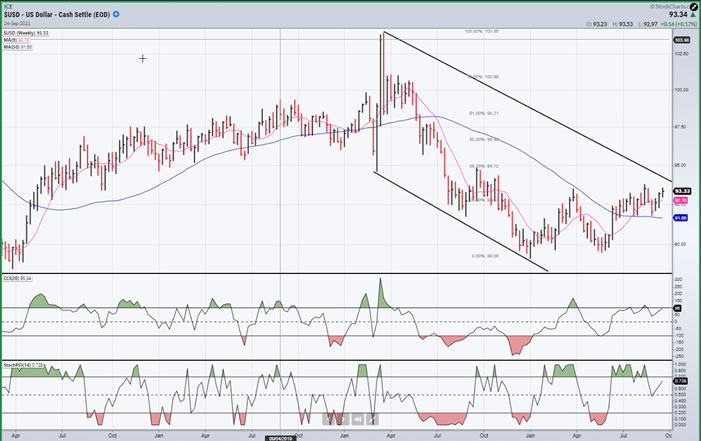
- USD (dollar) dly
- The dollar made a double bottom, rallied above its 50-dma, pulled back to it twice, and is rebounding again. It is now in a good position to move out of its corrective channel and challenge the former short-term high which lies exactly at the .382 retracement level of the decline from the high. It’s a good bet that the index will be able to reach it and perhaps even retrace 50% of its decline before running into difficulty, especially since the P-F chart calls for a move to ~96.
-
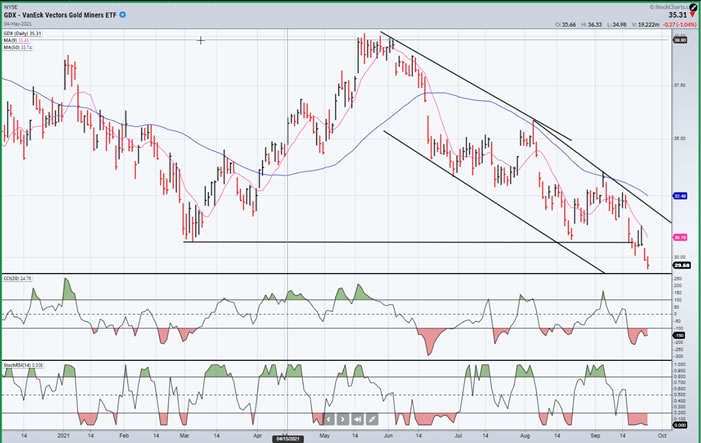
- GDX (gold miners) (dly)
- With the dollar picking up strength and looking to move higher, it’s no wonder that GDX is heading in the other direction. That means that GDX could go as low as 27 before it starts to create another short-term base.
-
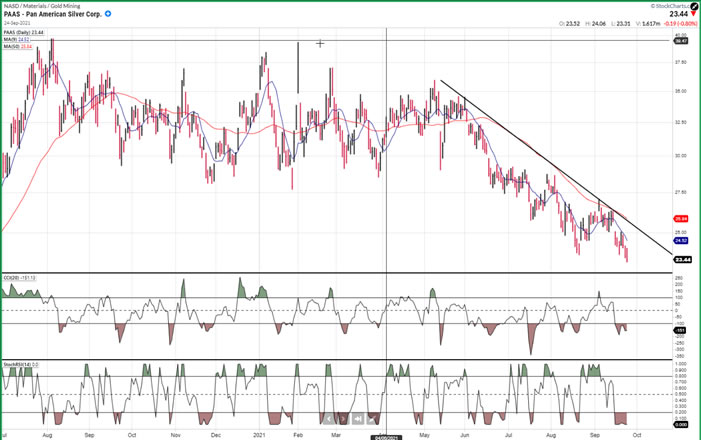
- PAAS (dly)
- PAAS will also be affected by strength in the dollar -- potentially pulling back down to at least 20.
-
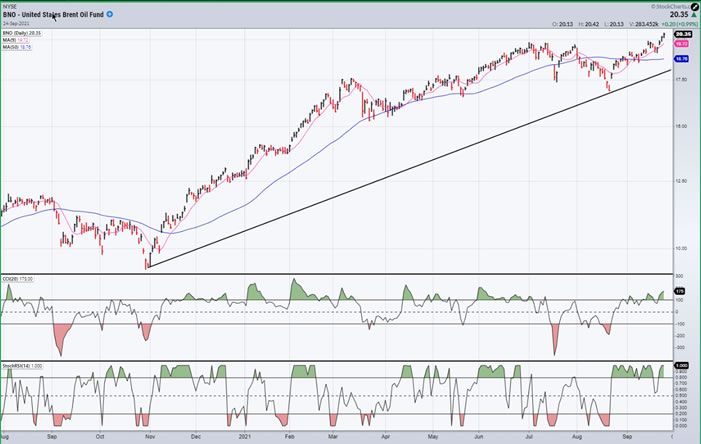
- BNO (Brent oil fund) dly
- BNO made a nice 3-wave correction, moved back above its 50-dma, and made a new high. It should be able to make it back to 22-23 before ending this move.
-
- SUMMARY
- SPX showed more weakness in its last short-term correction than it has since the end of last year. This probably indicates that an intermediate top is forming -- especially since the high came at 4546, within a point of the target which had been generated by the March 2020 P&F base.
Andre
Free trial subscription
With a trial subscription, you will have access to the same information that is given to paid subscribers, but for a limited time-period. Over the years, I have developed an expertise in P&F charting (price projection), cycles (timing), EWT (structure), and general technical analysis which enables me to warn subscribers of pending reversals in market trends and how far that trend can potentially carry. For a FREE 2-week trial, subscription options and payment plans, I encourage you to visit my website at www.marketurningpoints.com.
Disclaimer - The above comments about the financial markets are based purely on what I consider to be sound technical analysis principles uncompromised by fundamental considerations. They represent my own opinion and are not meant to be construed as trading or investment advice, but are offered as an analytical point of view which might be of interest to those who follow stock market cycles and technical analysis.
Andre Gratian Archive |
© 2005-2022 http://www.MarketOracle.co.uk - The Market Oracle is a FREE Daily Financial Markets Analysis & Forecasting online publication.