


Financial Markets Outlook 2023 - Recession Will Create Opportunities
Stock-Markets / Financial Markets 2023 Jan 07, 2023 - 11:18 PM GMTBy: Submissions
 Owen WIlliams writes: As we close out 2022, the worst year for stocks since 2008, we enter 2023 with an elevated risk of seeing an economic recession. From a U.S.-perspective, 2022 was a rare year during which both stocks and bonds suffered major losses. The fastest pace of interest rate hikes since the Volker era, with a 425 bp increase in the Fed Funds rate, penalized both major asset classes and will certainly have repercussions beyond 2022. As many market observers and Fed officials often remind us, interest rate hikes have a long and variable impact on the economy and markets.
Before presenting our outlook for each asset class, we share a few general observations for the new year. First, we have never seen two consecutive years during which BOTH equities and bonds have had dismal years. One of the two asset classes should turn in a much stronger performance in 2023. As we explain below, our bet is on fixed income, although there are many attractive areas in equities (outside of the indexes) which are already worth moving into for a long-term position.
Second, we see the extreme reversal in central bank interest rate policy as all part of the Covid episode. The central bank monetary policy, along with the Federal government fiscal policy, reaction to the Covid shutdown was disproportionate, maintained too long, and in our opinion was unnecessary. Policy mistakes in one direction often must be reversed by policy mistakes in the other direction. We believe that this is what is playing out. The Covid episode in its entirety (including the lagged policy mistakes) will become what we refer to as a “watershed moment” for markets. A watershed moment is a major dislocation in markets after any type of excess, be it market-drive (Tech Bubble) or policy-driven (Covid and Housing Bubble). After each dislocation in the past 40 years, we have seen a change in market leadership. As we explain in the Equity section below, the change in leadership we are expecting in this cycle is for relative equity market leadership to shift to international stocks and away from U.S. stocks, which have massively dominated since the Financial Crisis.
A final observation is that the era of ZIRP (zero interest rate policy) and easy money is finished, especially in the U.S. and probably in Europe as well. We had written several times about the “Everything Bubble” created by the great central bank experiment in non-traditional monetary policy. The Federal Reserve is left with a $10 trillion balance sheet that it will continue to unwind in the coming years. We believe that the social unrest caused by higher food, energy, and lodging prices will resonate with policy makers for some time. Political philosophers, such as Thomas Hobbes, have written centuries ago about the conflict between the elite class and the proletariat. When the working class can no longer afford the cost of living, the seeds are sown for a revolt. To maintain the social hierarchy intact, the elite class (including political leaders and central bankers) will strive to limit the deterioration in the standard of living of the working class. This means that we are unlikely to see the elite class run the risk of further inflation and deterioration of the condition of the working class just to stimulate the economy. Especially given that the economic gains of highly stimulative policy accrue to the wealth, the largest holders of financial assets. The upside is that normalized interest rates and quantitative tightening (QT) over the coming years will ensure the equity market orgy from 2009 is over. We expect a return to the two-way markets that prevailed in the 20th century.
Currency Markets
As asset allocators, we know that if we get the macro and the currencies right, we usually have a positive year. For USD portfolios, we are seeing an opportunity in assets with underlying foreign currencies. The U.S. dollar had been trending higher since mid-2021, on the back of a relatively stronger economy, demand for U.S. assets, and anticipation of higher dollar interest rates. The dollar has fallen back over the past two months, but we expect another opportunity to use strong dollars to buy foreign assets. The dollar typically rises in risk-off markets (as seen notably in the Covid Crisis as well as the Financial Crisis). What matters to us, with U.S.-dollar based accounts, is the underlying currency effect of holding non-U.S. assets. When a foreign currency is beaten down versus the dollar, buying assets this this currency should eventually allow the investor to profit from a tailwind. The contrary is obviously true as well. Right now, the dollar is historically strong. Remember that as the global reserve currency, the U.S. must keep the rest of the world awash with Eurodollars which places long-term downward pressure on the greenback.
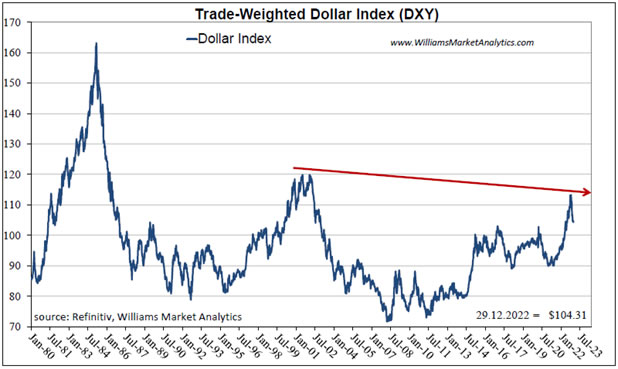
Thee $120 level on the DXY (2001 highs) would provide strong overhead resistance if the dollar puts in one more surge during a global risk-off trade.
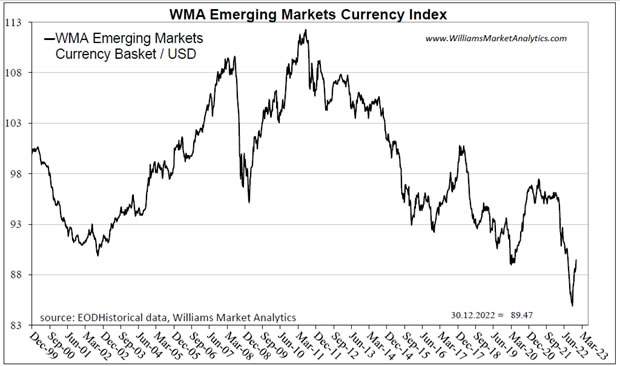
We developed a series of foreign currency indexes covering different regions. Our currency indexes are designed to replicate the same basket of currencies as popular tradable equity indexes. We start with our Emerging Markets Currency Index containing Chinese yuan, Indian rupee, Taiwan dollar, Korean Won, Brazilian real, Mexican peso, Saudi Arabian riyal, South African rand, Thai baht, Indonesian rupiah, UAE dirham, Kuwait dinar, Qatari riyal, and Malaysian ringgit with similar weights to the MSCI Emerging Markets Index (EEM). Our index is just off a 22-year low. The down-cycle from 2011, due to the Federal Reserve’s monetary policy experiment, is long in the tooth. This basket of currencies is a strong buy on any further pull-back from current levels. We are not hoping/waiting for a return to lows from last October to begin moving into the EEM.
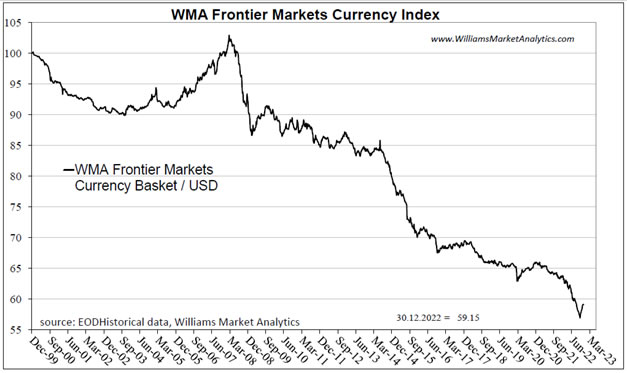
The Emerging Markets Currency Index is dominated by the EM majors (China and India). For a more exotic cross-section of EM currencies, we present our Frontier Market Frontier Markets Currency Index. This index holds Viet Nam dong, Romanian leu, Kazakhstan tenga, Moroccan dirham, Philippine peso, Colombian peso, Egyptian pound, Nigerian naira, Bangladesh taka, Oman rial, Jordanian dina, Kenyan shilling, Peruvian sol, and Pakistani rupee in similar proportions to that in the MSCI Frontier Index (FM). This basket of currencies has been on a one-way slide to hades since the Financial Crisis. While these are much less solid economies than those in the previous EM basket, at some point price falls to attractive levels vis-à-vis fundamentals. That is, at some point all the negativity gets priced in, and that is our call with the Frontier Markets. Besides the high potential for a reversal and currency tailwind, the FM tracker pays a respectable 3.20% dividend.
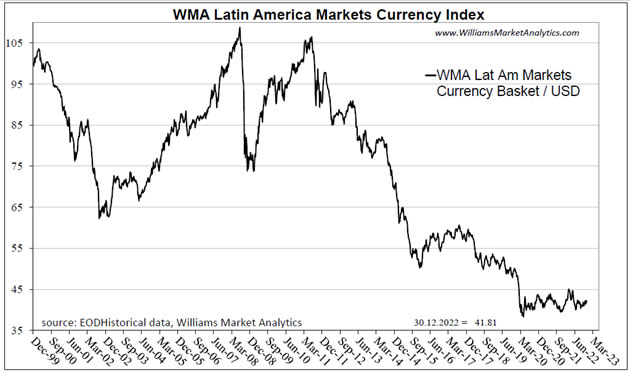
Our Latin American Markets Currency Index holds Brazilian real, Mexican peso, Chilean peso, Peruvian sol, and Colombian peso in similar weights to that of the S&P Latin American 40 Index. We really like the set-up here both in terms of the currency chart as well as the growth rates of Brazil and Mexico within the world economy. Making a long-term bet in Latin American stocks at current levels would seem to be an excellent risk/reward trade-off for investors who can stand the volatility.
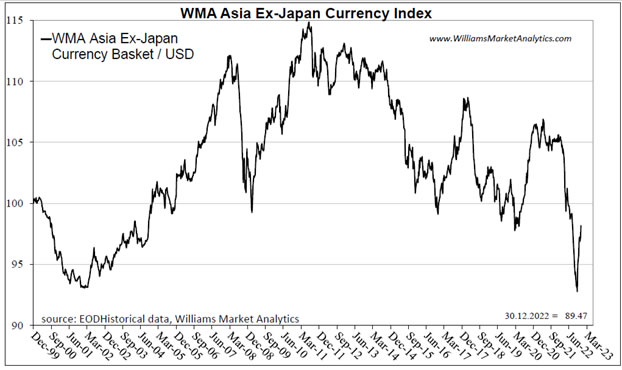
Our Asia ex-Japan Currency Index holds a basket of Chinese yuan, Indian rupee, Taiwan dollar, Korean Won, Hong Kong dollar, Singapore dollar, Thai baht, Indonesian rupiah, and Malaysian ringgit with similar weights to the MSCI Asia ex-Japan Index (AAXJ). Given the high weights in Chinese yuan and Indian rupees in both the MSCI Emerging Markets basket and the Asia ex-Japan basket, the two currency charts look similar. The EM basket of currencies has sold off a bit more than the AAXJ, but either currency basket is looking attractive for a U.S.-dollar investment with a multi-year horizon.
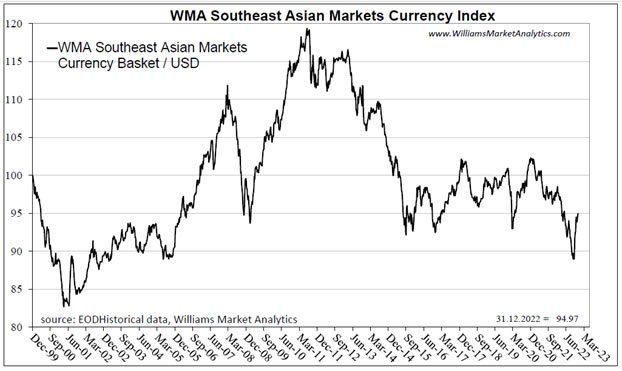
A subsection of the Asian market we like are the Southeast Asian economies, which eliminates the political risk of China. Our Southeast Asian Markets Currency Index holds Singapore dollar, Thai baht, Indonesian rupiah, Philippine peso, and Malaysian ringgit with similar weights to the FTSE Southeast Asia (ASEA). We like these countries, notably Singapore and Malaysia, for their fiscal discipline, trade balances and their central banks which don’t print money. We hold the ASEA tracker and will continue to add on weakness as a currency diversification play with a 2.8% yield.
For most individual and retail investors, it is easier to get FX exposure via ETFs. Remember, even if the ETF is traded in USD, the investor is indeed holding the underlying currencies in his portfolio. An alternative for more savvy investor who can hold foreign currencies in their brokage account, and wish to avoid the equity volatility, is to buy a basket of currencies and invest in the local money market.
Equity Markets
As we tend to be more value-oriented investors with a contrarian streak, we wrote in our 2022 Market Outlook that “we would shun U.S. large cap growth in 2022”. We don’t want to appear to be perma-bears, but we issue a similar message going into 2023. The nuance for the new year is that we are warming up to international stocks that are under-owned, unloved and now present very attractive relative valuations. At the same time, we extend our negative outlook to all U.S. index stocks. Our rationale is simple. First, the passive-investing indexing craze has ensured that all households have excessive exposure to the glamour stocks. When any trade gets too crowded, the future returns get compressed. Second, if the motto “Don’t Fight The Fed” works on the way up, it is disingenuous for equity strategists to advise clients to fight an unfriendly Fed and buy U.S. stocks.
Bulls are hoping that the Fed will cut rates in 2023, which will be stimulative for stocks. Our problem with this line of thinking is that the only reason the Fed would reverse course on interest rate policy if is the U.S. has a really bad economy. We don’t see a scenario in which the Fed would cut rates in 2023 due to inflation returning to 2% (without a severe economic crisis). This is not equity-positive.
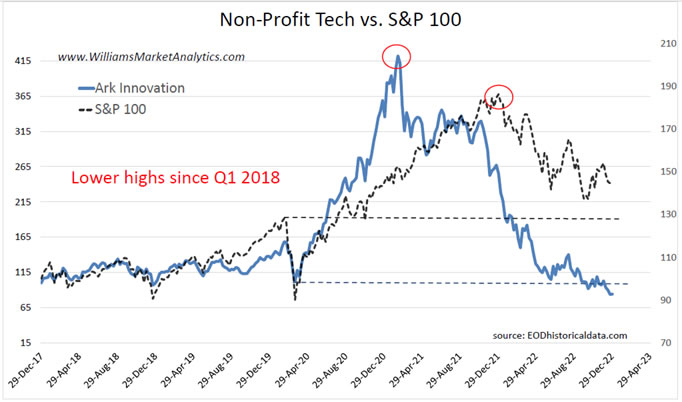
While equity prices have come down, especially the frothy areas of the markets (like non-profitable Tech, see chart below), we note that the broad equity indexes are still well above the pre-Covid peak. In February 2020 we were writing about valuations being extremely rich. We believe that the denominator in the S&P 500 P/E ratio is too optimistic for 2023 at the $200-$220 consensus forecast. Recession indicators, notably the yield curve (see Bond section below), suggest a much higher chance of more-than-mild recession, which is inconsistent with the current S&P 500 earnings forecast. There is most wood to chop on the downside for the over-owned index component stocks. This is not much unlike 2008-2009 during which the average stock bottomed in October 2008, but the indexes made new lows in March 2009. Moreover, history shows us that stocks tend to bottom early in an economic recession. Given that the recession has not yet officially begun, we don’t want to fight history and assume that the October low will be the absolute low for this cycle.
The aforementioned non-profitable technology stocks, as represented by the Ark Innovation Fund, are down -80% from the post-Covid peak. Using the S&P 100 as a proxy, blue-chip U.S. stocks experienced a maximum drawdown (thus far) of -27%. While not rushing in to buy the Ark Fund, we expect the bear market gap between Ark and the S&P 100 to shrink in 2023.
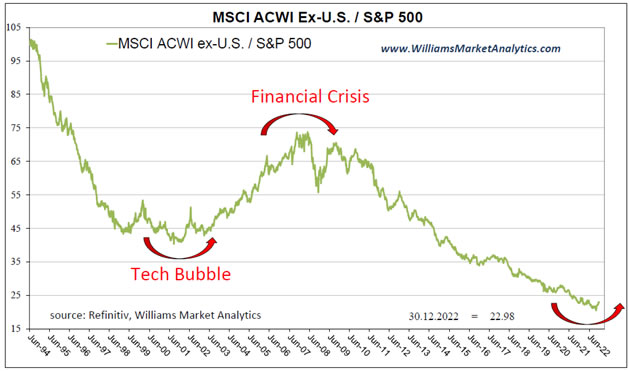
As mentioned above, we expect a change in market leadership following the dislocations created by the Covid crisis plus monetary/fiscal policy errors. Our next chart shows the MSCI All-Country World Index Ex-U.S. relative to the S&P 500. We denote with arrows the prior two watershed moments in the markets. The Tech Bubble ended nearly a decade of U.S. stock outperformance versus international stocks. The secular trend of outperformance in international stocks ended with the Financial Crisis. As readers can see, U.S. stocks have enjoyed an unprecedented stretch of over 12-years of outperformance. We’ll take the opposite side of this trade from 2023 onward. Federal Reserve ZIRP and money printing was the principal driver of the U.S. outperformance since 2009, and this driver has ended.
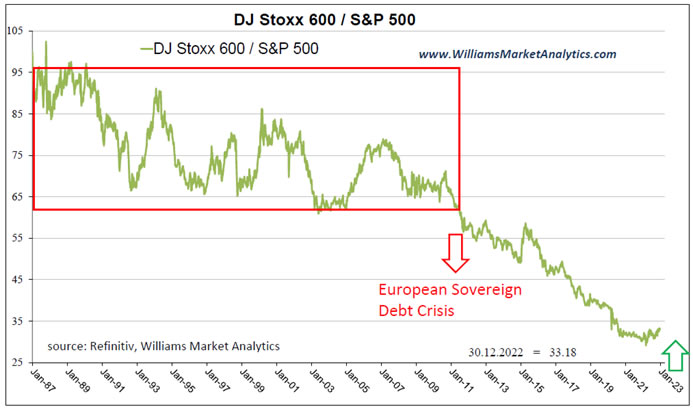
We drilled down to see exactly what segment of “international stocks” has lagged U.S. stocks the greatest extent. Below we plot the Dow Jones Stoxx 600, the European equivalent of the S&P 500, against the S&P 500. We see that from 1987 to 2011, U.S. and European stocks took turns with relative leadership, as denoted by the red box. Then from 2011, European stocks fell out of bed on a relative basis. Not uncoincidentally, 2011 corresponded to the start of the Sovereign Debt Crisis and the inventive European Central Bank programs (TALF, TARP, PEPP) to bail out the PIIGS (Portugal, Italy, Ireland, Greece, and Spain).
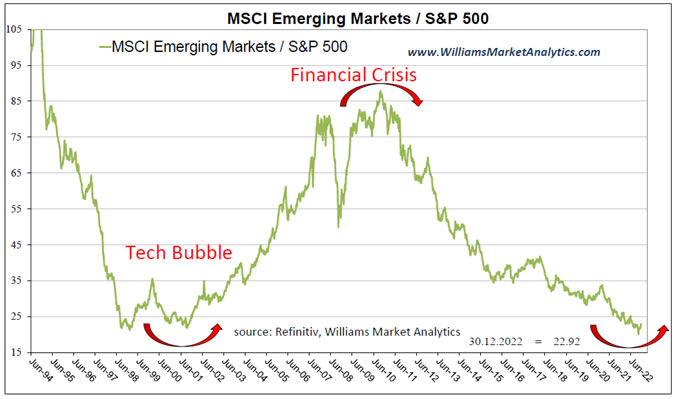
Next, we took the MSCI Emerging Markets Index relative to the S&P 500. We find this chart compelling. Emerging Market stocks have retraced all their relative outperformance from the Tech Bubble through the Financial Crisis. While not doing technical analysis on this chart, we see the current level on this relative index just south of 25.0, almost the same as in 1998 and 2001, as an area that may interest asset allocators.
In terms of thematic trades, we like natural resources, for which we have a dedicated portfolio. Natural resources are the quintessential inflation hedge, and while oil stocks had a huge positive year in a down market, they are still not excessively expensive. Nonetheless, we prefer other areas of the resources sector while waiting for some profit-taking in oil stocks. Goldminers remain compelling in a potentially stagflationary environment in 2023.
For our Quantitative Equity Selection (QES) strategy, the focus remains on selecting companies that return cash to shareholders, offer attractive valuations relative to their industry group as well as their own past, and have strong financial positions. In light of our exposé above, we have a preference for non-U.S. stocks.
Finally, in our Dynamic Global Rotation (DGR) strategy we continue to like solar stocks, as the energy transition will necessarily pass through this key renewable energy. In addition, we have added a fund investing across the clean energy space (ICLN) to double down on the energy transition theme. Security/defense should also be an attractive thematic trade. From defense contractors (ongoing war in Ukraine, potential military conflicts elsewhere in the world such as Taiwan and North Korea) to cyber security, revenue growth in these companies seems assured. Finally, we have been invested in infrastructure stocks in the U.S., as Congress is unlikely to stop its tax-and-spend ways and rebuilding the U.S. infrastructure is one thing that both parties can agree on.
Commodity Markets
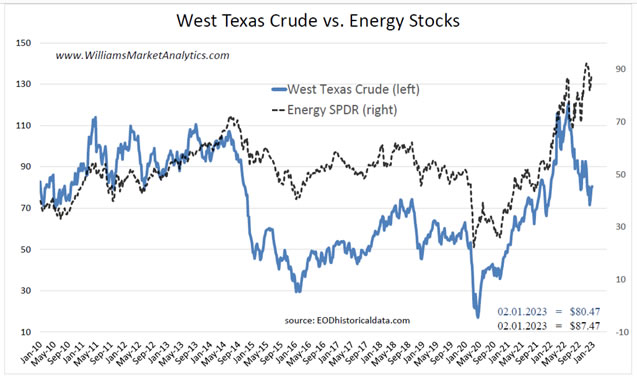
Crude oil prices were driven by supply concerns in 2022, notably following the invasion of Ukraine and global sanctions placed on Russia. West Texas crude oil touched $130/barrel in March just after the Russian invasion before retreating to almost $70/barrel at year-end (blue line in chart below). We see a marked decoupling between crude oil prices and the oil stocks (black dotted line) since last summer. While many energy experts claim that oil companies are still very profitable in the $50-$60/barrel range, we see too much optimism short-term baked into the oil stocks. If a more severe recession plays out in 2023, demand for energy will fall off and profits estimates will be incorrect, regardless of the geopolitical supply shocks and any bounce in oil prices. We don’t have strong conviction on the direction of oil prices in 2023 and are penciling in a wide trading range of $60-$90/barrel. Crude oil prices have already come down in anticipation of waning demand as the U.S. and Europe should see slower/negative growth for 2023. The Russian situation is likely priced in by now. The wildcard is a China reopening, which would put upward pressure on oil prices.
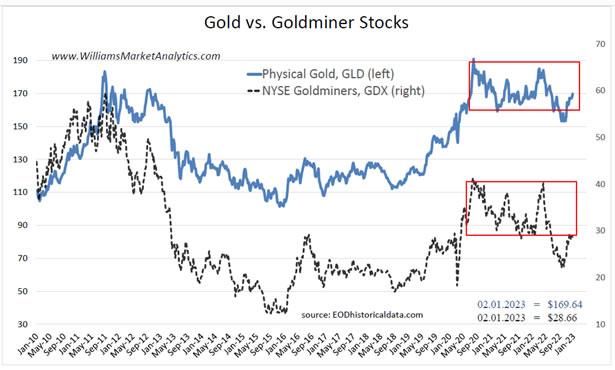
We had been bullish on gold going into 2022. In our 2022 Market Outlook we wrote that the stagnation in the gold price in 2021 was partially “due to the belief that cryptocurrencies are a safe-haven substitute for gold. Nothing could be stupider than to buy into this idea. Bitcoin and the other cryptos will implode (likely sooner than later) and gold will be the biggest beneficiary.” This turned out to be a prescient forecast. While gold have a volatile 2022 to end the year largely unchanged, Bitcoin fell another -63% in 2022. We like once again the gold and goldminers trade in 2023 with our outlook for a stagflationary environment. As shown in the chart below, after a couple years of sideways action, the gold complex has consolidated the gains from the run-up off 2019 lows and may break out to the upside in 2023.
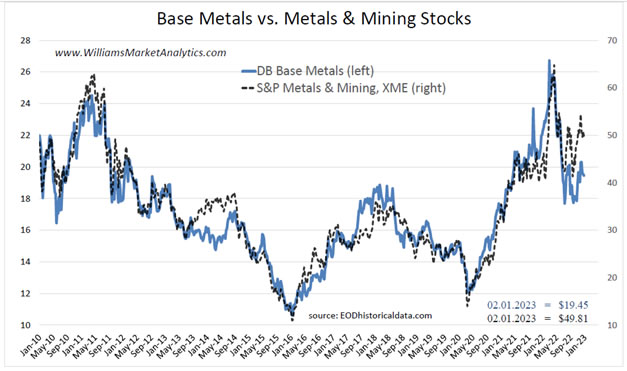
Base metals and the Metals & Mining stocks (XME) have shown a historically tight correlation, as shown in our chart below. Base metals are more sensitive to economic growth and we are less constructive (relative to gold) on seeing the 2022 price highs revisited in 2023.
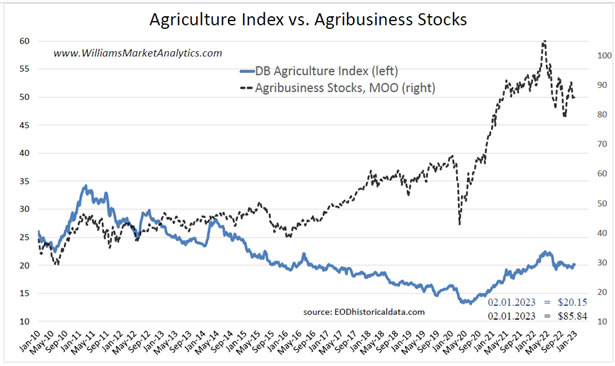
Our last commodity chart looks at agricultural prices (black dotted line) versus the agribusiness stocks as measured by the MOO tracker fund. Agribusiness stock prices, like the overall U.S. equity market, are still inflated relative to the pre-Covid highs. With a recession on the horizon, we see few arguments in favor of an allocation to the agriculture sector.
In sum, we are bullish on the gold complex and would get constructive on the oil stocks after some reversion in prices to a more sustainable uptrend line.
Bond Market
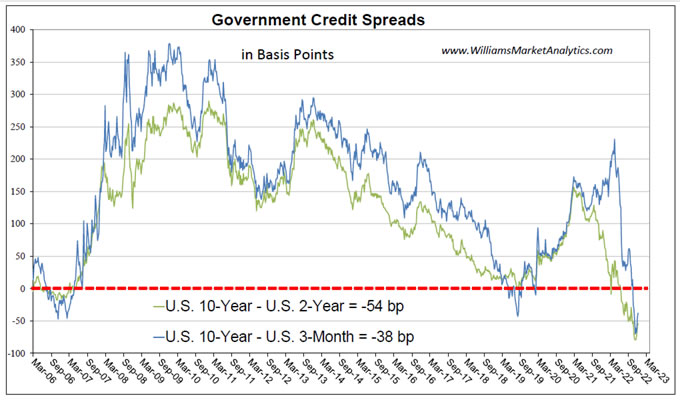
The most telling chart for investors is that of the government credit spreads. While not every yield curve inversion has predicted a recession, we have never had a U.S. recession without the yield curve priorly inverting. Our chart below shows the inversion of both 10-year/2-year yields (green line) as well as 10-year/3-month yields (blue line) is much deeper than even seen prior to the Great Financial Crisis. This does not mean that we are expecting a recession of the severity of 2008-2009, but the odds of escaping a recession in 2023 seem slim.
With the U.S. 2-year yield at 4.40%, we are warming up to bonds. While real yields are negative based on current inflation rates, we believe that TINA (there is no alternative to equities) is dead and it’s time to allocate back into bonds. If correct about our recession outlook, bond yields are likely not far from their cycle highs.
The last time the Fed Funds rate was at 5% the debt/GDP ratio was 60%. We are now facing 5% Fed Funds in 2023 with a debt/GDP ratio of 120%. While in the near-term this should be more of a concern to investors in risk assets, the question of the sustainability of the U.S. debt burden remains. At some point, the higher financing costs on a massively higher debt burden will not end well. While a U.S. credit crisis would be a black swan in 2023, which we are not explicitly preparing for, we would nonetheless prefer a global bond allocation, both for risk diversification and currency diversification.
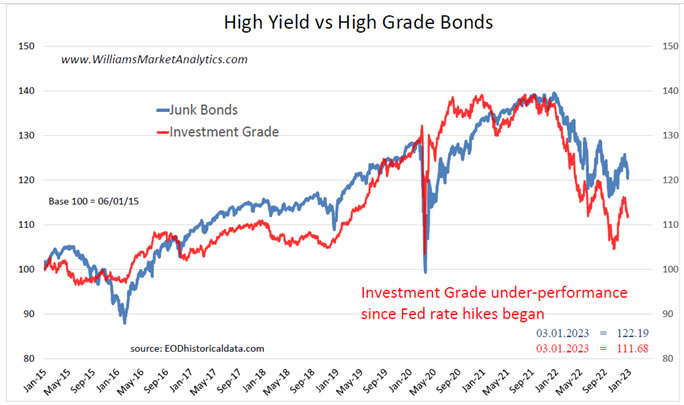
The drop in corporate bond prices has also been remarkable with the Fed’s rapid rate hikes. Interestingly, the Investment Grade segment (red line) has fallen more than High Yield bonds (blue line). Investment Grade, like Treasurys, were much more over-valued going into 2022 with the absence of a sufficient risk premium and the official bond purchases. We expect risk premiums to continue to expand in 2023. Both of these bond segments could see attractive entry points in 2023, perhaps around the Covid lows.
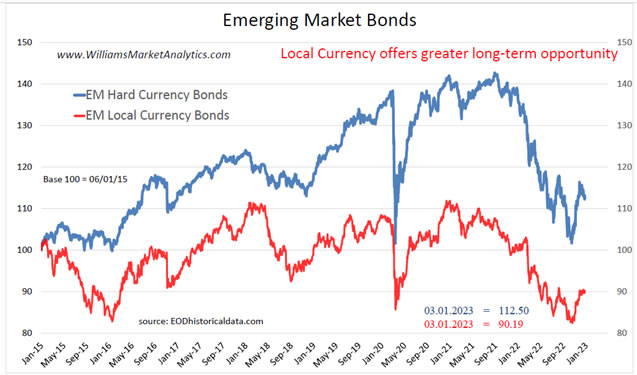
For long-term investors, we continue to like Emerging Market bonds. As mentioned above, the dirt-cheap levels of these currencies gives a huge potential tailwind once the secular down-trend of EM currencies is over. EM bonds tends to trade like small-cap stocks, so if the risk-off trade prevails in 2023 we’ll first see lower prices on the EM bond indexes. The chart below shows the EM local currency bonds (red line) and the EM bonds issued in USD (blue line). The secular EM currency weakness is quite visible in the decoupling of the two lines since January 2015. We definitely prefer the local currency version which has much more upside potential, if our bet on a rebound in EM currencies proves correct. The EMLC (local currency ETF) is currently yielding 5.6% compared to 5.0% for the EMB (hard currency ETF).
Conclusion
Our strategy portfolios did very well in a tough year for financial markets. Our QES Strategy gained +6.6%, the DGR Strategy was unchanged, and the Natural Resources Portfolio edged higher by +3.0% for 2022. We don’t believe that 2023 will be much easier. We generally prefer bonds over stocks, will buy foreign currencies against USD on any continuation of the risk-off trade, and are positioning for secular outperformance in international stocks.
By Owen WIlliams
Owen Williams is professor of finance at the EM Lyon Business School. He holds a PhD in finance from the Grenoble Ecole de Management and is a CFA charterholder. His research interests include asset pricing, currency markets, and portfolio theory.
© 2022 Copyright Owen WIlliams - All Rights Reserved
Disclaimer: The above is a matter of opinion provided for general information purposes only and is not intended as investment advice. Information and analysis above are derived from sources and utilising methods believed to be reliable, but we cannot accept responsibility for any losses you may incur as a result of this analysis. Individuals should consult with their personal financial advisors.
© 2005-2022 http://www.MarketOracle.co.uk - The Market Oracle is a FREE Daily Financial Markets Analysis & Forecasting online publication.