


Bad Corporate Earnings Points to Retest of Stock Market Lows
Stock-Markets / Stock Market Valuations Jan 03, 2009 - 12:05 PM GMTBy: John_Mauldin

 2008: Annus Horribilis, RIP
- The Aftermath of Financial Crises
- ISM: Anywhere You Look It Is Bad
- Another Round of Earnings Disappointments
- A Bear Closes His Short Fund
- La Jolla, Bermuda, Florida, and Writing
I meant to take yet another Friday away from my writing, but as I am researching for next week's annual prediction issue, there is so much material that begs to be covered that I thought I would put out a short letter with 3 or 4 points as a preface to my prognostications of next week.
This week we look at a very interesting, if not altogether encouraging, piece of research on the length and severity of recessions that come during periods of financial crisis, which can apply to not just the US but all countries that are involved in the current crisis. But being forewarned is better than blindly stumbling through, so we will take some time to peruse it. Then we (briefly) look at the depth of the manufacturing numbers in the US, which leads us into the recent bout of earnings downgrades and some thoughts as to where that might suggest the market is going. That should be enough for this week.
But first, and quickly, my annual Strategic Investor Conference that is co-hosted by my partners Altegris Investments will be April 2-4 this year in La Jolla. We will have information out next week, but save the date in your calendar. Like last year, we expect it to sell out. We have the best line-up of speakers ever: Martin Barnes, Dr. Woody Brock, Dennis Gartman, Louis Gave, and George Friedman are already committed, and we have a few who we expect to announce soon.
And we had a large response to the Richard Russell Tribute Dinner for that Saturday night, April 4. That, too, looks like it could sell out. If you have already responded that you are interested, we will contact you shortly. If you haven't and would like to be part of a dinner honoring Richard Russell for a lifetime of service to investors through writing his Dow Theory Letters, then drop me a response and we will add you to the list of invitees. And now to the letter.
The Aftermath of Financial Crises
What happens to an economy after a financial crisis? Since there are few who would deny that we have been in and are experiencing a financial crisis, it might be instructive to look at what has happened in previous crises in other countries. Fortunately, the work has been done for us by Professors Carmen Reinhart of the University of Maryland and Kenneth Rogoff of Harvard, in a recent paper entitled "The Aftermath of Financial Crises."
There are very real differences between normal business-cycle recessions and a recession brought on by a financial crisis. The latter are much more severe. Sadly, we are in the latter type.
Reinhart and Rogoff had done an earlier paper on financial crises and their aftermath, just in developed countries, and now they have expanded their research to include developing countries as well. What they have found is that there is not that much difference in general between developed and developing economies after a crisis. (About which I will comment later, but first let's look at their work.) Quoting:
"In our earlier analysis, we deliberately excluded emerging market countries from the comparison set, in order not to appear to engage in hyperbole. After all, the United States is a highly sophisticated global financial center. What can advanced economies possibly have in common with emerging markets when it comes to banking crises? In fact, as Reinhart and Rogoff (2008b) demonstrate, the antecedents and aftermath of banking crises in rich countries and emerging markets have a surprising amount in common.
"... Broadly speaking, financial crises are protracted affairs. More often than not, the aftermath of severe financial crises share three characteristics. First, asset market collapses are deep and prolonged. Real housing price declines average 35 percent stretched out over six years, while equity price collapses average 55 percent over a downturn of about three and a half years. Second, the aftermath of banking crises is associated with profound declines in output and employment. The unemployment rate rises an average of 7 percentage points over the down phase of the cycle, which lasts on average over four years. Output falls (from peak to trough) an average of over 9 percent, although the duration of the downturn, averaging roughly two years, is considerably shorter than for unemployment. Third, the real value of government debt tends to explode, rising an average of 86 percent in the major post-World War II episodes.
Interestingly, the main cause of debt explosions is not the widely cited costs of bailing out and recapitalizing the banking system. Admittedly, bailout costs are difficult to measure, and there is considerable divergence among estimates from competing studies.
But even upper-bound estimates pale next to actual measured rises in public debt. In fact, the big drivers of debt increases are the inevitable collapse in tax revenues that governments suffer in the wake of deep and prolonged output contractions, as well as often ambitious countercyclical fiscal policies aimed at mitigating the downturn."
As long-time readers know, I believe you must be very careful when using average numbers of past performance of investments or economic data. While they can be useful in helping to determine direction, using them as an absolute predictor of future patterns can be quite misleading. As an example, it would be misleading to say that unemployment in the US or England will rise to 11% because average unemployment is up 7% over the recent trend numbers in good times. The actual level will in all likelihood turn out to be higher or lower, depending on a number of factors.
That being said, the numbers do suggest that unemployment will be much higher than we see in a typical recession and will last longer. How much higher and how much longer we won't know for some time. Let's look at a few graphs which tell the story about housing prices and equity markets after a financial crisis.
The next graph shows that equity price declines are much steeper, but shorter in duration.
Interestingly, on unemployment they note:
"... that when it comes to banking crises, the emerging markets, particularly those in Asia, seem to do better in terms of unemployment than do the advanced economies. While there are well-known data issues in comparing unemployment rates across countries, the relatively poor performance in advanced countries suggests the possibility that greater (downward) wage flexibility in emerging markets may help cushion employment during periods of severe economic distress. The gaps in the social safety net in emerging market economies, when compared to industrial ones, presumably also make workers more anxious to avoid becoming unemployed."
So much for the Detroit bailout.
The 9.3% drop in GDP they noted as the average drop illustrates the problem of using averages as predictors. The really horrible drops were mainly due to the Asian crisis of 1997 and the Argentinean debacle of 2001. Throw those out and my guess is that it looks like an average drop of 5%, which is still a very serious recession indeed.
I will let you read their conclusion, as it is short and instructive. You can read the entire paper at http://ws1.ad.economics.harvard.edu/faculty/rogoff/files/Aftermath.pdf. It is short (for an economics paper) and quite readable. Now, their conclusion [emphasis mine]:
"An examination of the aftermath of severe financial crises shows deep and lasting effects on asset prices, output and employment. Unemployment rises and housing price declines extend out for five and six years, respectively. On the encouraging side, output declines last only two years on average. Even recessions sparked by financial crises do eventually end, albeit almost invariably accompanied by massive increases in government debt.
"How relevant are historical benchmarks for assessing the trajectory of the current global financial crisis? On the one hand, the authorities today have arguably more flexible monetary policy frameworks, thanks particularly to a less rigid global exchange rate regime. Some central banks have already shown an aggressiveness to act that was notably absent in the 1930s, or in the latter-day Japanese experience. On the other hand, one would be wise not to push too far the conceit that we are smarter than our predecessors. A few years back many people would have said that improvements in financial engineering had done much to tame the business cycle and limit the risk of financial contagion.
"Since the onset of the current crisis, asset prices have tumbled in the United States and elsewhere along the tracks lain down by historical precedent. The analysis of the post-crisis outcomes in this paper for unemployment, output and government debt provide sobering benchmark numbers for how the crisis will continue to unfold. Indeed, these historical comparisons were based on episodes that, with the notable exception of the Great Depression in the United States, were individual or regional in nature. The global nature of the crisis will make it far more difficult for many countries to grow their way out through higher exports, or to smooth the consumption effects through foreign borrowing. In such circumstances, the recent lull in sovereign defaults is likely to come to an end. As Reinhart and Rogoff (2008b) highlight, defaults in emerging market economies tend to rise sharply when many countries are simultaneously experiencing domestic banking crises."
ISM: Anywhere You Look It Is Bad
The Institute for Supply Management (ISM) has been giving us data on US manufacturing for 50 years (formerly as the NAPM). Many other countries now have similar numbers, often published by a "PMI" or Purchasing Management Institute. The data is presented in a similar fashion. If an item is growing it is above 50, and if it is contracting it is below 50. Depending on how good or bad the data is, the index can be well above or well below 50. While a level of say, 57, as opposed to 62 or 52, for the manufacturing index does not reveal all that much, there are two things that are very useful in the surveys. First, is the number above or below 50? Quite simply, are we growing or contracting? Second, what is the trend over the past 3-6 months?
And looking at those two factors, it is ugly all over the world. In some places, very ugly indeed. Russia is at 33.8, down 20% from November. India is down to 44, and the trend is downward. Hong Kong is down for six months in a row, to 39. Australia is at 33.7. (Thanks to Dennis Gartman for the world tour.) We will look next week at China, whose numbers show a sharp decline in export growth.
We got the US ISM numbers today, and they were just awful. The overall index is down to 32.4, down over 25% in the last three months. This is the lowest level since 1980, in what was a severe recession. The ISM survey points to one of the deepest contractions in industrial output in the post-World War II era, this quarter. The forward-looking details were weak and point toward further declines in the ISM manufacturing index. Businesses are cutting orders, inventories, and workers because of tight credit conditions, declining final demand, and shattered confidence. Manufacturers reported in December that their customers' inventories were too high, a bad omen for future production.
But when you look at the components, it gets even more sobering. New Orders are down over 50% from six months ago, to 22.7. This is the lowest number since they began keeping records in 1949. Production is down to 25.5. New Export Orders were way down (35.5), as was Order Backlog (23).
"Another standout in the December report was the decline in the prices-paid index [down to 18! -JM] which fell to its lowest level since 1949. The abrupt decline in energy and other commodity prices is driving the index lower. Lower input costs may entice manufacturers to pass on the savings via reducing their prices. If businesses broadly across industries cut prices to preserve some sales, it will heighten the threat of deflation." (www.economy.com)
This is all suggestive of an economy in serious decline. The GDP for the 4th quarter should be down somewhere between 4-5%. It is likely we are going to see even more earnings downgrades in the next few months, and as I outline below, we have probably not yet hit bottom. As long as the ISM numbers look like the ones we just analyzed, things are likely to be getting more difficult. And that goes for the world in general, not just the US economy.
Another Round of Earnings Disappointments
So, how did the US market respond to this data? The Dow was up 258 (almost 3%) and the NASDAQ up a sprightly 3.5%. Nothing to worry about.
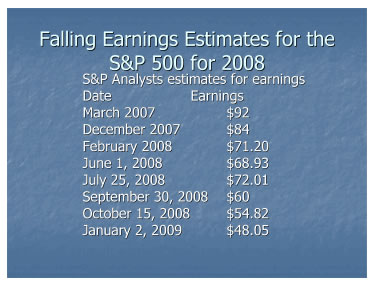
However, earnings, as you might expect, are not doing all that well. For the last year I have been highlighting how earnings estimates are dropping for the S&P 500, as analysts try and catch up with the reality on the ground. They are still behind the curve.
Let's look at their estimates for earnings in 2008. They started at $92 in early 2007 and are now down to $48. This chart is not something to inspire confidence in stock analysts.
On a trailing one-year basis, that puts the Price to Earnings Ratio (P/E) at over 19 as of today's close at 925, which does not make the market cheap. But last year's earnings are history. What about 2009? Again, the analysts are in a race to find the bottom.
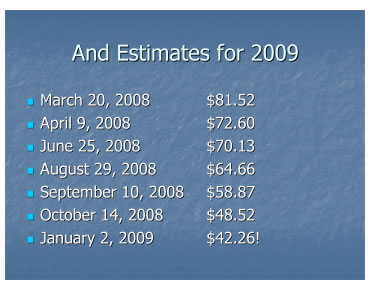
The current projections are for $42.26 for 2009. That makes the forward P/E 22. That doesn't look like value at all, when the historical average is closer to 15.
Bulls would argue that the market is forward-looking and that all the bad news has been priced into the market. I would counter that the market has so far done a bad job of pricing in bad news, given the fall of the markets last year in the face of a recession. As I repeat incessantly, the US stock market falls an average of 43% during recessions. The stock market was not discounting a recession last January or even in May, even after a very serious financial crisis.
But how bad can it get? Analysts must surely by now have lowered their estimates to more realistic numbers. Shouldn't we start to price in the recovery from here? Well, no, not if you look at the last recession.
In 2001, as-reported earnings were $24.67. Operating earnings in 2002 were $27.57. Does anyone think the current recession will be milder than the last one? Or shorter?
And it gets worse. Core earnings, which take into account pension and other under-reported liabilities, were less than $16 in 2001, and so P/E on a core earnings basis topped out at 71, and on an as-reported basis were as high as 46!
Of course, after that the stock market went on a tear, almost doubling over the next five years. And today the market seems to be suggesting that many people are afraid to miss out on the fun of the next bull market run.
A Bear Closes His Short Fund
I had a long conversation with Bill Fleckenstein today. Bill runs a short-only hedge fund and has done so for many years. He is one of the more outspoken and well-known bears. And he told me that he is closing his short fund. Shutting it down and sending all the money back.
"Right now, my list of stocks that I want to be long is longer than the list I want to short." In the current environment he wants the ability to go long as well as short. For those of you who are long the market, that is probably as good an indicator as any that we are closer to the bottom than we are from the future top!
Interestingly, we agreed on a possible scenario for the first half of the year. We both see a very tradable rally going into spring. Then, when we get even more earnings disappointments at the end of the first quarter and warnings at the end of the second quarter, we could see another test of the November 20 lows. Earnings disappointments are the catalyst for protracted bear markets. But the wild card is the coming economic stimulus package. We have never been in a situation like this.
While I am negative on the stock market (and markets around the world) in general, there are some stocks which are now at reasonable values. When you can find a stock with a P/E ratio lower than its dividend, and with that dividend reasonably well protected, I can't argue with a long-term investor buying that stock. 6% dividends can cover a lot of market sins at these levels. (Don't ask for stock recommendations: I don't analyze stocks. My business is analyzing the economy and money managers. A man has to know his limitations.)
The market seems to be thinking the economy will be coming out of recession in the third quarter of 2009, hence the rally. I think that is optimistic. As the research above suggests, this could be a longer and deeper recession than anyone younger than 50 can possibly remember.
Next week, we will get into the actual forecast for 2009.
La Jolla, Bermuda, Florida, and Writing
I fly to La Jolla week after next to meet with my partners Altegris Investments and plan our year. Next week good friend Cliff Draughn flies into Dallas and we get to meet, share dinner, and watch the Mavericks.
I will be spending some time at the end of the month in Bermuda and a few months later in Florida, for speaking engagements. Tiffani and I are working hard on our book, Eavesdropping on Millionaires, and I expect that some of that Bermuda R&R time will be spent writing. Our intention is to have the book in the hands of the publisher by the end of February.
And speaking of intentions, I turn 60 this year in October. It is my intention to be down another ten pounds to 185 and to be bench pressing 185 and hopefully doing 60 push-ups, to greet the last half of life. That goal, along with finishing my long-delayed book, The Millennium Wave, is enough to have in the way of New Year's resolutions. If I get those done, it will be a good year.
And I am optimistic about the coming year. There are lots of opportunities, and I hope to be able to find a few, and maybe share one or two of those ideas with you. Let me close by very sincerely wishing you a very happy and healthy New Year!
Your planning to be in the gym a lot this year analyst,
By John Mauldin
John Mauldin, Best-Selling author and recognized financial expert, is also editor of the free Thoughts From the Frontline that goes to over 1 million readers each week. For more information on John or his FREE weekly economic letter go to: http://www.frontlinethoughts.com/learnmore
To subscribe to John Mauldin's E-Letter please click here:http://www.frontlinethoughts.com/subscribe.asp
Copyright 2008 John Mauldin. All Rights Reserved
John Mauldin is president of Millennium Wave Advisors, LLC, a registered investment advisor. All material presented herein is believed to be reliable but we cannot attest to its accuracy. Investment recommendations may change and readers are urged to check with their investment counselors before making any investment decisions. Opinions expressed in these reports may change without prior notice. John Mauldin and/or the staff at Millennium Wave Advisors, LLC may or may not have investments in any funds cited above. Mauldin can be reached at 800-829-7273.
Disclaimer PAST RESULTS ARE NOT INDICATIVE OF FUTURE RESULTS. THERE IS RISK OF LOSS AS WELL AS THE OPPORTUNITY FOR GAIN WHEN INVESTING IN MANAGED FUNDS. WHEN CONSIDERING ALTERNATIVE INVESTMENTS, INCLUDING HEDGE FUNDS, YOU SHOULD CONSIDER VARIOUS RISKS INCLUDING THE FACT THAT SOME PRODUCTS: OFTEN ENGAGE IN LEVERAGING AND OTHER SPECULATIVE INVESTMENT PRACTICES THAT MAY INCREASE THE RISK OF INVESTMENT LOSS, CAN BE ILLIQUID, ARE NOT REQUIRED TO PROVIDE PERIODIC PRICING OR VALUATION INFORMATION TO INVESTORS, MAY INVOLVE COMPLEX TAX STRUCTURES AND DELAYS IN DISTRIBUTING IMPORTANT TAX INFORMATION, ARE NOT SUBJECT TO THE SAME REGULATORY REQUIREMENTS AS MUTUAL FUNDS, OFTEN CHARGE HIGH FEES, AND IN MANY CASES THE UNDERLYING INVESTMENTS ARE NOT TRANSPARENT AND ARE KNOWN ONLY TO THE INVESTMENT MANAGER.
John Mauldin Archive |
© 2005-2022 http://www.MarketOracle.co.uk - The Market Oracle is a FREE Daily Financial Markets Analysis & Forecasting online publication.