


Recession Light at the End of the Tunnel or an Oncoming Freight Train?
Economics / Recession 2008 - 2010 Mar 20, 2009 - 01:26 PM GMTBy: Paul_L_Kasriel

 With regard to the economy, we believe there are faint signs of light at the end of the tunnel. Real consumer spending increased by 0.4% in January (and is likely to be revised up) and the decline in February nominal retail sales of 0.1% suggests that the decline in real consumer spending that month will not be severe. For the first quarter as a whole, we now expect a contraction in consumer spending much less severe than last year's fourth-quarter contraction of 4.3%. Although we do not expect to see outright growth in real consumer spending until the fourth quarter of this year, we believe the deepest quarterly contraction is behind us.
With light motor vehicle sales idling just above 9 million units at an annual rate, it appears that for the first time since 1945 there are more used cars and trucks being scrapped than there are new ones getting out on the highways. At some point in the not-too-distant future, the purchases and production of cars and trucks will be stepped up. In fact, production increased by almost 24% in February, admittedly from an extremely depressed January seasonally-adjusted annualized base of only 4.6 million units.
When the Fed's Term Asset-backed securities Liquidity Facility (TALF) kicks into a higher gear, more credit will start flowing again to households for the purchase of motor vehicles. And, of course, we households still need to buy staples, not to mention toothpaste and food. As an aside, the TALF program is now authorized to provide up to $1 trillion of financing for the purchase of newly-issued asset-backed securities. This amount is approximately one-third of the net credit created by the private financial system in 2007; one-half the net credit created in 2008. So, the TALF program is considerably more than chump change.
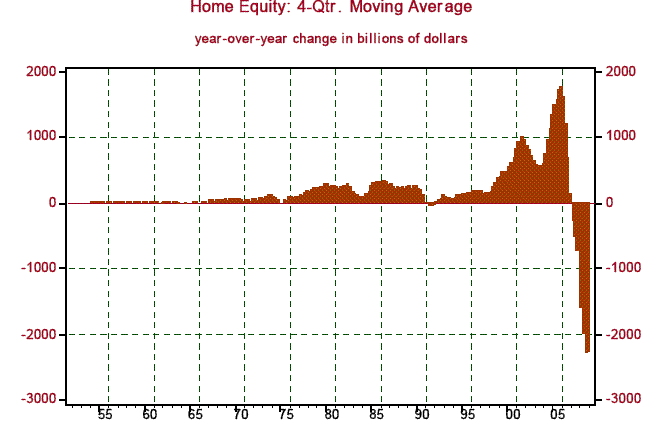
Aside from TALF's freeing up some auto and credit card loans, where will we households get the funds to purchase anything? After all, the home ATM has sprung a leak. That is, the equity in our houses that we were borrowing against fell by almost $2.3 trillion in 2008 (see Chart 1), or by about 21% of disposable personal income. We do not yet have fourth-quarter data for mortgage equity withdrawal (MEW), but as of the third quarter of last year, it was zilch. So, MEW most likely is now minus zilch.
Chart 1
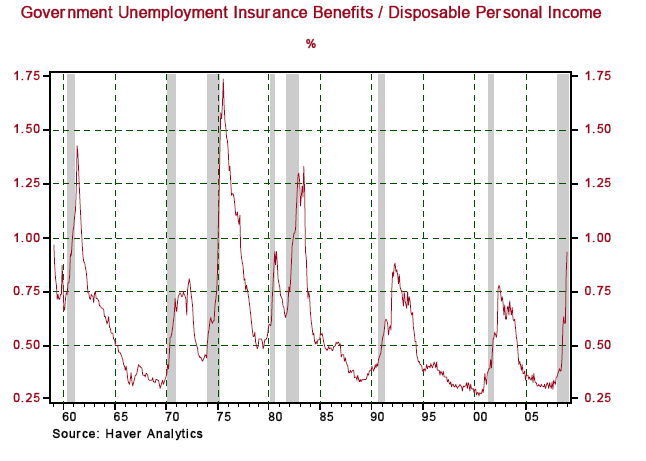
But we still have income to fall back on. In fact in January, our disposable personal income jumped by 1.7% (see Chart 2), thanks in no small part to government unemployment insurance, which accounted for 0.93% of disposable personal income, the highest percentage since July 1983 (see Chart 3). Thank goodness for automatic stabilizers, huh?
Chart 2
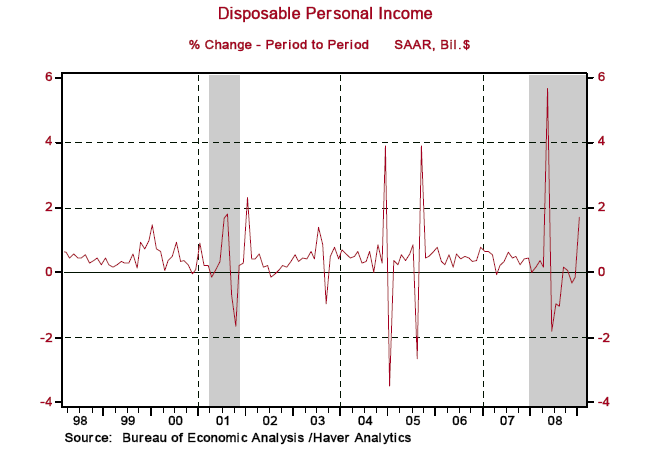
Chart 3
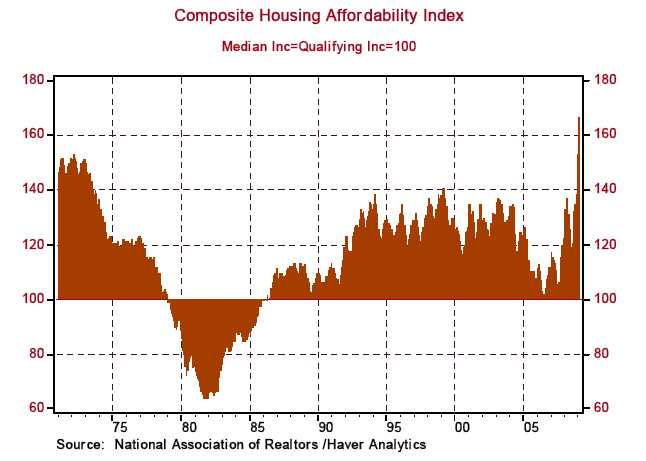
Is housing about to turn up? No. But is there any good news on housing? Yes. The National Association of Realtors (NAR) index of housing affordability hit a record high in January, which, if taken literally, means that housing has never been more affordable since the series started in January 1971 (see Chart 4).
Chart 4
Housing affordability is a function of the median price of a house, median household income and the mortgage rate. Although the NAR makes a monthly estimate of median household income, we do not have that monthly series. So, as a proxy, we will do what New York Times reporter Floyd Norris did recently, we will use per capita disposable personal income and compare the median sales price of a single-family existing home to it. Chart 5 shows that this ratio has fallen to about 481% - the lowest since the series started in January 1968 - largely because of the sharp decline in house prices.
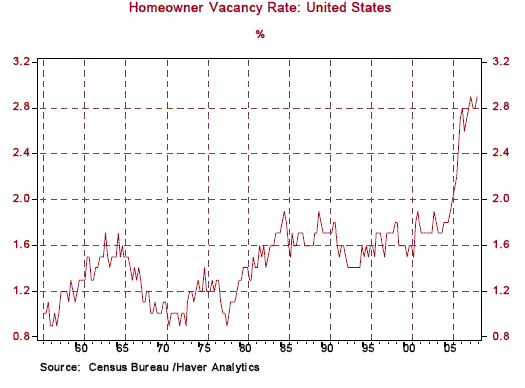
Although per capita disposable personal income is likely to weaken over the remainder of the year as the unemployment rate heads toward 10%, house prices are also likely to fall more in percentage terms, thus pushing this ratio even lower. What about mortgage rates? As shown in Chart 6, at 5.12%, the contract mortgage interest rate on the purchase of a single-family existing home was the lowest in January 2009 since the series began in January 1963. We are well aware that there is a record overhang of for-sale residential real estate (see Chart 7), but, as we just showed, housing affordability is at a record high. Builders continue to slash production of non-rental housing units and the federal government has instituted a program to mitigate foreclosures. In sum, the dynamics to bring the housing market into equilibrium are at work.
Chart 5
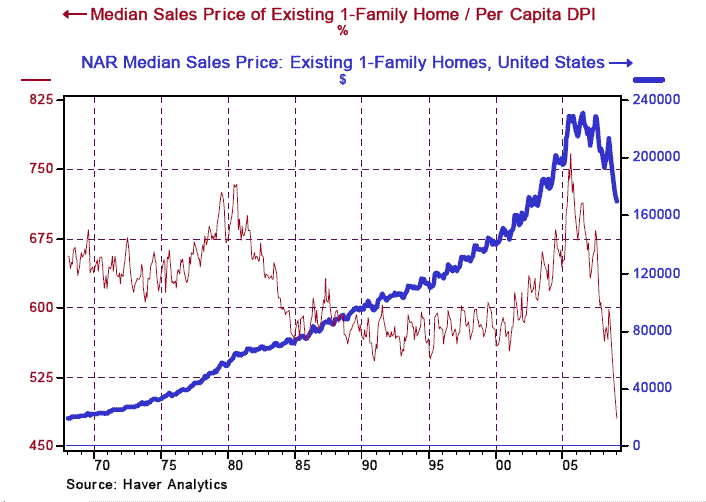
Chart 6
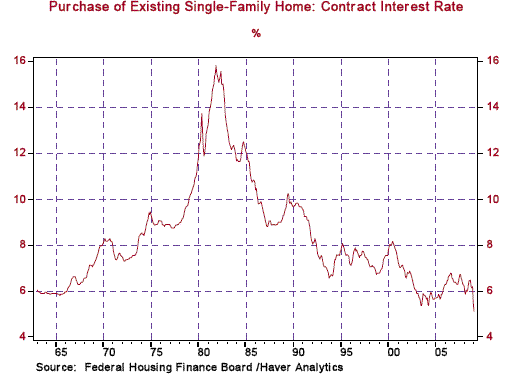
Chart 7
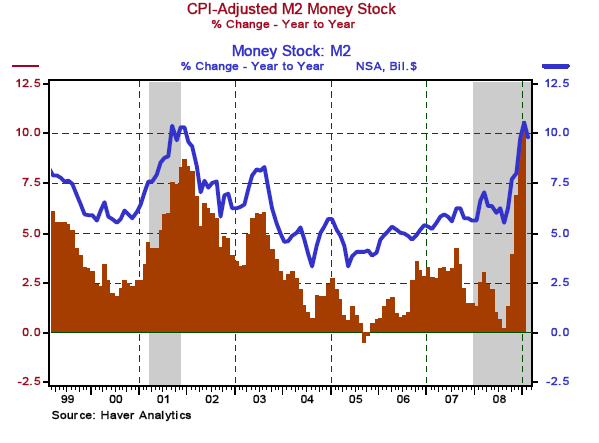
There is another reason to believe that there is light at the end of the tunnel - the behavior of the money supply. No such light was visible in the early 1930s. As Chart 8 shows, both in nominal and price-adjusted terms, the M2 money supply was contracting in 1932 and 1933. In contrast, both the nominal and price-adjusted M2 money supplies are growing at a fast pace (see Chart 9). We concede that the demand to hold that money stock also may be growing as well, but the economy would be in even worse shape if that increased demand for money were not being accommodated by an increased supply. When the federal government's fiscal stimulus program is implemented, we expect the money supply to grow even more rapidly and its "velocity" to increase because the increased money supply will be to fund increased government spending.
Chart 8
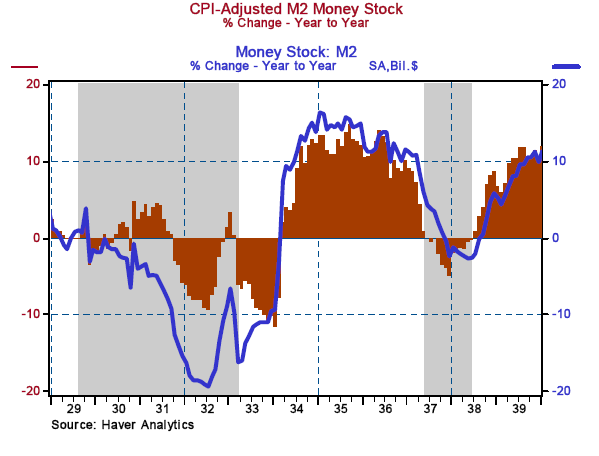
Chart 9
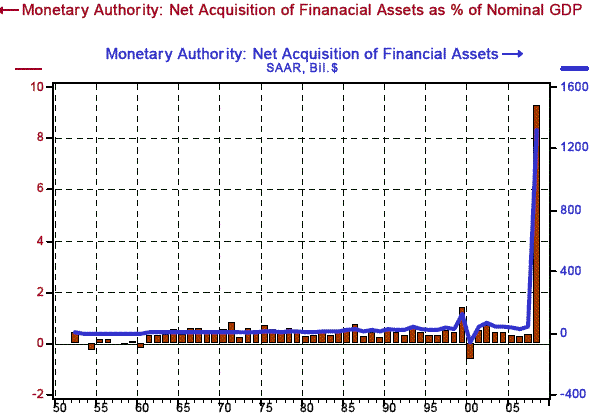
Staying on the subject of the financial system, there was a sharp slowing in credit creation in 2008 by the private financial sector (see Chart 10). However, stepping into the breach was the Federal Reserve. In 2008, the Fed's net acquisition of financial assets - essentially the new credit created by the Fed - totaled $1.3 trillion or 9.25% of nominal GDP - a postwar record both in absolute dollar terms as well as relative terms (see Chart 11). The combination of the TALF program and announced future purchases of Treasury bonds/mortgage-backed securities/agency debt will expand the Fed's balance sheet by an additional $2 trillion (14% of 2008 nominal GDP) in 2009. In effect, the Fed is creating massive amounts of credit in place of the private financial system's more normal credit creation as banks and other private financial institutions repair their balance sheets. This emergency transfusion of credit by the Federal Reserve will help get economic growth restarted later in the year.
Chart 10
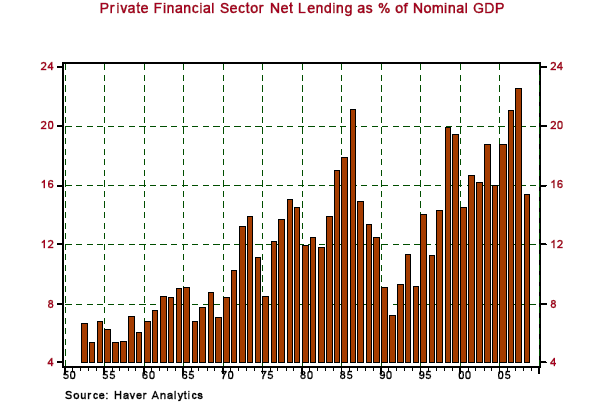
Chart 11
Lastly, industrial metals prices appear to have bottomed out. What is more, these prices have bottomed despite the dollar's appreciation against other major currencies (see Chart 12). So, the rise in industrial metals prices is due to something other than a depreciating dollar. The stabilization in industrial metals prices may be due more to declining supply than increasing demand. But this typically is the prelude to increased production down the road. That is, when demand does increase after inventories have been pared, production must be stepped up to accommodate the increased demand.
Chart 12

In sum, although the economy remains mired in a severe recession, we have seen nothing of late to dissuade us from our forecast of recovery getting underway in the fourth quarter of this year. In fact, what we have seen of late increases our confidence in the forecast.
THE NORTHERN TRUST COMPANY ECONOMIC RESEARCH DEPARTMENT March 2009 SELECTED BUSINESS INDICATORS
Paul Kasriel is the recipient of the 2006 Lawrence R. Klein Award for Blue Chip Forecasting Accuracy
By Paul L. Kasriel & Asha Bangalore
The Northern Trust Company
Economic Research Department - Daily Global Commentary
Copyright © 2009 Paul Kasriel
Paul joined the economic research unit of The Northern Trust Company in 1986 as Vice President and Economist, being named Senior Vice President and Director of Economic Research in 2000. His economic and interest rate forecasts are used both internally and by clients. The accuracy of the Economic Research Department's forecasts has consistently been highly-ranked in the Blue Chip survey of about 50 forecasters over the years. To that point, Paul received the prestigious 2006 Lawrence R. Klein Award for having the most accurate economic forecast among the Blue Chip survey participants for the years 2002 through 2005.
The opinions expressed herein are those of the author and do not necessarily represent the views of The Northern Trust Company. The Northern Trust Company does not warrant the accuracy or completeness of information contained herein, such information is subject to change and is not intended to influence your investment decisions.
Paul L. Kasriel Archive |
© 2005-2022 http://www.MarketOracle.co.uk - The Market Oracle is a FREE Daily Financial Markets Analysis & Forecasting online publication.