Stock Market "Sucker-Rally-Dead-Cat" Still Yowling! Market-Long-Waves Say's "Bull-Run Warning"
Stock-Markets / Stocks Bull Market Apr 17, 2009 - 08:10 PM GMTBy: Andrew_Butter

 The consensus is that the stock market rally is on it's last legs, market-long-wave analysis says different and that the markets will be 15% to 30% up on today by end 2009 and that the medium term trend is also upwards.
If it were up to Sticks and Stones (can break my bones) that Cat would be road-kill by now. On the 14th March Professor Roubini pronounced the rally that started 10th March was a dead-cat-sucker-bounce.
(reflections_on_the_latest_dead_cat_bounce_or_bear_market_suckers_rally).
Since then, there has been a queue around the block chanting for the darn thing to quit yowling
(sucker-s-rally-approaching-an-end),
Fundamental Reasons Why the Stocks Bear Market Will Return
Tyler Dyrden says out of 80 managers he surveyed, the consensus was overwhelmingly that the cat was DEAD and just going through its final last agonizing death spasm (notes-on-the-impending-market-reversal). David Tice of Federated Investors Inc is predicting a 62% fall (david-tice-s-p-500-may-plunge-to-325).
David Fry says it's all just banks gambling naked again (and probably stoned too); except this time with American Taxpayers' money (thursday-outlook-grasping-at-straws).
That's plausible, they have a lot of money to play with now and they burnt their fingers lending money, so why not just play the market? What do you expect if you attempt to cure a pathological gambler of his habit, by paying off his debts and giving him another stake; and the same rules - "(Big) bonus if the bets come off, more stake where that came from if the bets blow out"?
Mmm...
These extraordinary, almost divine, levels of consensus reminds me of the Golden Age when you could survey 80 card-carrying professionals...rating agencies, realtors, mortgage lenders, originators and distributors of toxic assets, VAR Rocket Scientists, brand-name investment banks, and economic gurus; and they all would swear to you that house prices would go up and up forever and forever, Amen.
Except of course for Professor Roubini, the IMF, Professor Shiller, and the International Valuation Standards Committee1 (and some other "weirdoes").
Could it possibly be that the "consensus" is wrong again?
Or put it another way, when the consensus starts to agree with Professor Roubini, there has to be something supernatural going on, like a Black Swan epidemic perhaps? Or to put it another way again, if everyone is so convinced why aren't they shorting the living daylights out of the market?
Of course it all depends on navigation - (or valuation; same difference). Compared to 1929 and subsequent events, which seems to be the reference of choice these days, the multi-trillion dollar question is where exactly IS America right now?
This is a TEST! So if the Great Depression is a guide to where this black comedy is RIGHT NOW, where exactly is America in the divine plot?
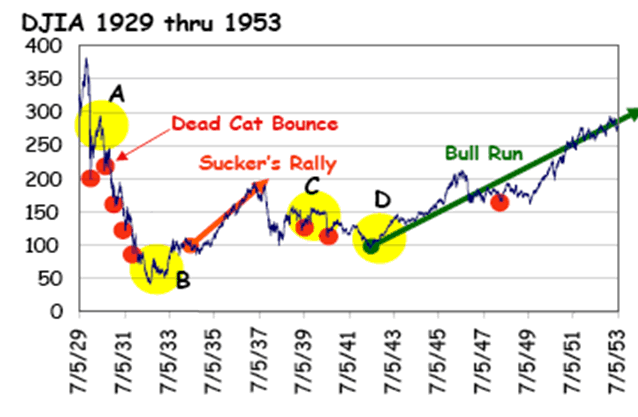
Is it (A) just one "dead cat bounce" after the first BIG drop, with plenty more of those to come? Or (B), somewhere near the bottom but with a prolonged "sucker rally" to look forward to, or (C), sucker-rally behind but still a period of uncertainty to navigate, or (D) at the start of a bull rally that will last for five or more years?
It's important to know such things if you got a helicopter squadron full of more than a couple of trillion dollars that you want to deliver.
If only to make sure, as Chairman Bernanke testified the other day, that ordinary Americans ONLY lose 40% of their net worth rather than 70%, (with the risk of getting it wrong and putting the children and grand-children into a mire of un-payable National Debt - by dropping the stuff into a swamp full of the same shysters and charlatans who "Madoff" with the first load)!
The consensus?
The consensus is that the USA just had a crash, and what you get after crashes is an outbreak of "dead cats" bouncing down the road and "suckers" getting sucked in and spat out over and over, and the economy is tanking so the market HAS to go down!!
Well, if you believe that was either a dead cat or a sucker, there is only one thing for it. Short the rally, and clean out the American taxpayers (once again) who have apparently (inadvertently thanks to their investment in the banks) gone Long.
There is however (perhaps) another explanation, which is that the peak of the madness was 2000 and that, then, the dead-cat was put on life-support by Allan Greenspan.
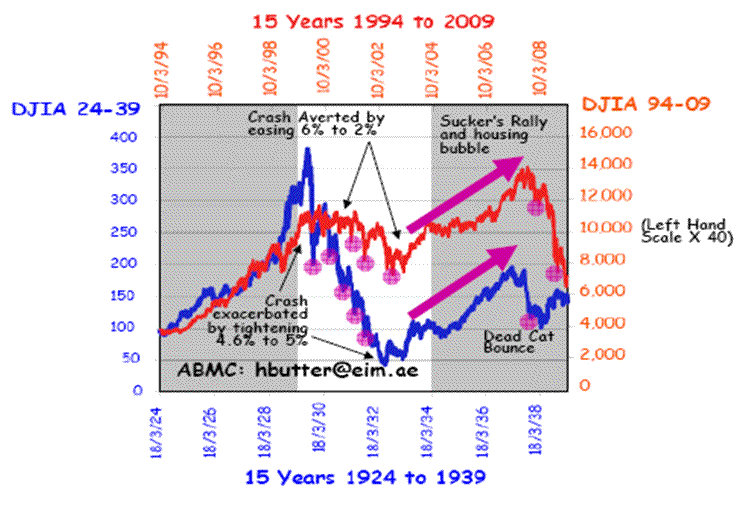
In this comparison chart the "peak" was about 4x the foot of the bubble, (a) there was a correction (1929 and 2000), then (b) there were a lot of dead cat bounces in the 1930's but hardly any in the early 2000's thanks to the "steady hand" of Chairman Greenspan on the tiller; then in both cases (c) there was a "sucker-rally", then (d) another fall.
There is no doubt that pain in 2000 was avoided by the actions of the Fed, but there was a cost that is being paid for now, with interest (and if that's not paid, by a pound of flesh from the heart of every American).
The mistake was carrying on too far. This was done by setting interest rates lower than the rate of inflation as it was calculated before they introduced the idea of rental equivalence in 19872, which is when the way that CPI was calculated, was changed.
The next chart illustrates the difference between the "Politicized CPI" and "Real CPI".
"Politicized CPI"2 is the one that makes the Fed and the Government in general look good, so that less than a year ago Chariman Bernanke could stand up in front of a crowd of Harvard Undergraduates (no less), who were sitting in the pouring rain holding on to his every word (if they managed to stay awake - for such monologues are by nature extraordinarily boring).
In this presentation, The Chairman explained how America The Great had been blessed for the past twenty years with God-Given low rates of inflation, and they should all be thankful from the bottom of their hearts that such "plenty" had been bestowed upon them by their wise and benevolent leaders.
"Real CPI" is well, what inflation actually was, if for example you measure it using a coherent valuation standard (such as International Valuation Standards1).
Note: This chart was prepared by a certain "TC" and was shown in articles on this subject by Mr. Mike Shedlock who kindly given me permission to reproduce it here (Real Interest Rates Soar as Case Shiller CPI Crashes to Minus 5%).
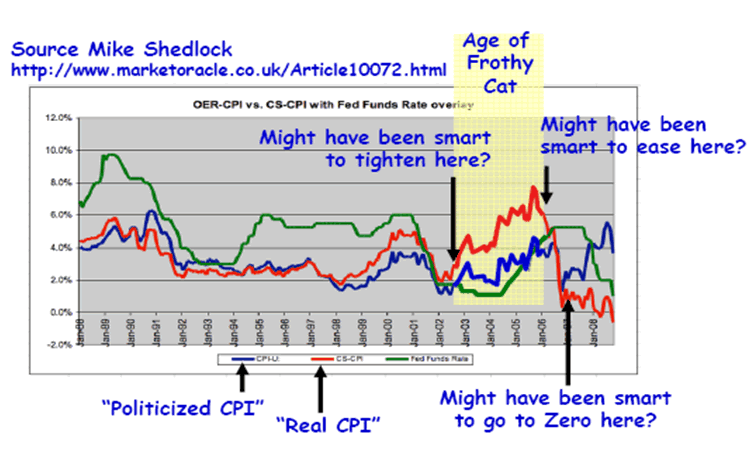
I have added a few remarks (in blue).
Perhaps in 2000 stock market were about as over-valued as 1929 just the "crash" took a different trajectory down thanks to the joys of monetarism-gone-mad?
If so, the period in time where America shot itself in the foot, might one day aptly be called or the "Age of Monetarism Gone Mad" or perhaps the "Age of the Frothing Dead Cat"?
Market-Long-Waves:
Market-Long-Wave analysis is similar to the analysis that Vector Vest uses to time stock markets.
Basically you do a valuation of the asset (called other-than-market-value if you are using International Valuation Standards (http://www.ivsc.org/)3), and compare that to the price.
The reason that "value" is interesting is because when price is less than value that's generally a safe time to buy, when it's more, it's risky, and how risky depends on how much more.
Then you look at the harmonics of the oscillations around the mean, which is another way of applying Farrell's Law #2 (Day-Trade-Online-Christopher-Farrell/dp/0471331201) or efficient market hypothesis (wiki/Efficient_market_hypothesis).
The difference with Market-Long-Waves compared to Vector-Vest is that (a) the valuations are done strictly in accordance with International Valuation Standards (personally I don't trust "earnings" which Vector-Vest relies on - I certainly don't believe the recent "earnings data" put out by Goldman Sacks (b) market-derived-data (at least the stuff I looked at) says that the function of yield is an "S" curve not linear as is assumed by Vector Vex (c) the equilibrium line is figured from the long-term average such that on average the integral of the period above the line is equal to what it is below, over 100 years or so (d) this analysis gives annual data not daily (like Vector-Vest).
This is what you get for house prices and the DJIA where the axis are the extent of over or under-pricing by the market with the equilibrium line set at zero (i.e. PRICE/Value -1); I put in the house price scenario for comparison.
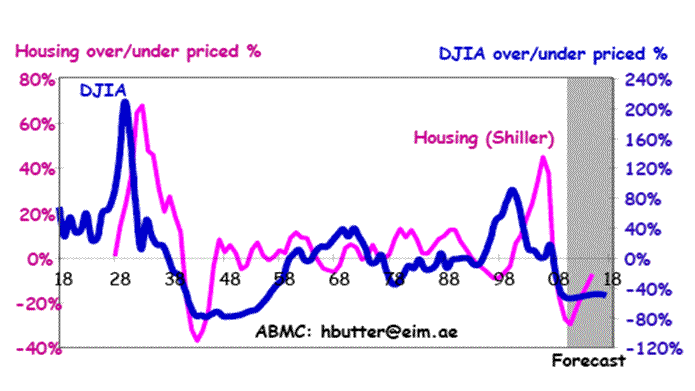
This analysis suggests:
[1]: 2000 was the stock-market peak over-pricing, what is happening now is the inevitable fall-out from that.
[2]: Now stock markets are about 37% under valued (the model has a statistical uncertainty which means it could be 20% to 45% and the model is for annual data so monthly data adds further uncertainty).
45% is likely how far they will go because in every market I have ever looked at (houses, commercial real estate, stocks (not just in USA)), the amplitude of the down wave is on average the same as the amplitude of the preceding "up-wave".
(Note: That's a little hard to "see" from the chart because of the way arithmetic works, for example in 2000 the DJIA was 84% over-priced (x 1.84) so you expect the down wave to be 1- 1/1.84 = 46% below).
So what's the signal for the start of a bull run?
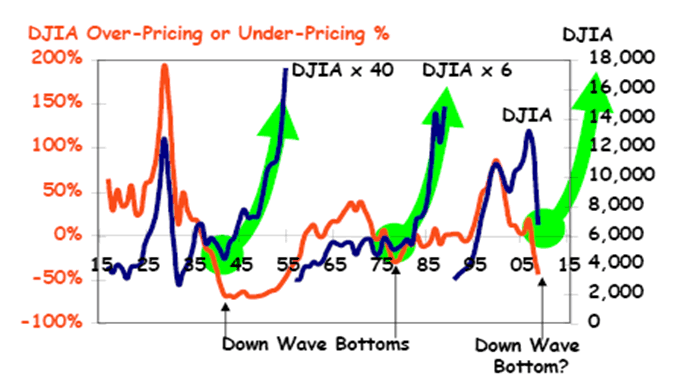
Well have a look at this chart:
What's (a little) complicated is so that I could show all three "events" on the chart (for comparison), I multiplied the DJIA (average annual data so the full extent of peaks & troughs are smoothed out); by 40 for the "Great Depression" boom and bust, by 6 for the 1950-70 boom and bust, and left today's data the same (also note, I ended the line at 9th March 2009 when DJIA was 6,574).
Remarks:
[1]: Following a big over-pricing it takes a while for reality to sink in and for all the morons who borrowed money to gamble naked and/or stoned (or the morons who lent money to people to do that), to basically sleep it off.
Now there is a "Nanny State", it takes longer for reality to become revealed which causes no-end of irritation to the people left behind who have to pay off the (other peoples) debts.
Either way, if the initial fall-out ends up so that the market is still over-priced there is the risk of a "sucker-rally".
[2]: The POINT is that a bull-run starts is when the "down-wave" has reached it's maximum.
The Alternative view:
The alternative explanation to the "end of the world scenario" is (a) there was a the boom, (b) then a slow bust, then (c) there was a the sucker rally, (d) the DJIA (and the S&P 500 in tandem) are about at or close to their maximum "down-swing" of about 46% below equilibrium.
IF:
(a) Nominal GDP growth in 2009 is Minus 6%.
(b) Long-term interest rates rise to 3.5% thanks to the purchase of Treasuries.
THEN
The according to this analysis the AVERAGE for the DJIA 2009 will be in the range 8,900 to 10,500 (the limits of the uncertainty of the model).
Seeing as the average so far was 7,789 that translated into a DJIA (and the S&P 500 etc) rise on average of 13% to 30% from now until Dec 2009.
Then
How steep and quick the bull run goes will depend on (a) how quickly nominal GDP comes back from negative to positive (nominal is what counts - CPI is for politicians), and (b) where long term interest rates head.
Either way, I would be extremely surprised if the lows of 9th March 2009 are tested again and if end 2009 is not well up on the current stock price.
NOTES:
1International Valuation Standards Committee (IVSC)
Set up after the Asian crisis (which was a dress rehearsal for the current crisis (over-lending to real estate caused a bubble and banks went bust - but on a much smaller scale)). In 2000 they published International Valuation Standards (IVS) which recognized TWO valuation concepts (a) Market Value (the value if the market is working properly - by sales comparison SC)) and (b) Other-Than-Market-Value which you are supposed to use when the market is not working properly (i.e. it is either experiencing a bubble or a boom or a slump or a bust), this is normally worked out by depreciated replacement cost (DRC), or income capitalization (IC).
The "test" of whether the market is in what IVS calls "disequilibrium" or not is whether all three methods (SC + DRC + IC) all give the same answer, if they do then it's safe to use SC (which is a lot quicker and cheaper to do (you just look at the price-tag (mark-to-market)), if not well then if you do use SC you risk a Credit Crunch (which can be a lot more expensive than doing your valuations properly).
No one uses IVS because it is anti-cyclical unlike the valuation approaches mandated under US GAAP and IFRS, which as Chairman Bernanke and a few other people recently realized (in a flash of inspiration) are "pro-cyclical". So if you mandate that auditors and regulators rely on IVS (theoretically), you don't get booms and busts. So where's the fun (and perhaps more important, how else do you get on Prime Time)?
In 2003 IVSC wrote to the Bank of International Settlements to explain to them that the valuations that were being used to asses capital adequacy (by auditors and bank regulators) were "fundamentally flawed and bound to be misleading" (http://www.bis.org/bcbs/cp3/invastco.pdf).
This could explain why these days few believe audited results, and why it was unwise to the point of reckless to believe them in the past (evidenced by the fact that many banks that were signed-off as going concerns at the end of 2007…weren’t).
2 Politicized CPI
The Politicized CPI is the estimate that you get when you calculate the cost of the "shelter" component of CPI for 90% of the economy (the percentage that own their own homes (by the money they spend on shelter)) from what the residual 10% does (the amount of money that gets spent on renting). That might have seemed like a good idea at the time - but that's what caused the housing bubble (along with mark-to market which was how the auditors and regulators signed off on the inflated values which fuelled the bubble), and without a bubble, there wouldn't have been a bust.
3Other-than-market Valuation of DJIA
The basic approach relies on the notion that the net income of all companies in USA is broadly a constant proportion of the Value Added of GDP and that the level of representation of listed companies in the economy was broadly constant over the past 100 years. So "Value" by income capitalization ought to be broadly a function of GDP divided by a function of long-range-interest rates. It is (R-Squared = 89% to 94% depending on treatment of interest rates). The function of interest rates is an "S" curve, broadly the line of 1/long-term-interest rates is linear from 3% to 6%.
By Andrew Butter
Andrew Butter is managing partner of ABMC, an investment advisory firm, based in Dubai ( hbutter@eim.ae ), that he setup in 1999, and is has been involved advising on large scale real estate investments, mainly in Dubai.
© 2009 Copyright Andrew Butter- All Rights Reserved
Disclaimer: The above is a matter of opinion provided for general information purposes only and is not intended as investment advice. Information and analysis above are derived from sources and utilising methods believed to be reliable, but we cannot accept responsibility for any losses you may incur as a result of this analysis. Individuals should consult with their personal financial advisors.
Andrew Butter Archive |
© 2005-2022 http://www.MarketOracle.co.uk - The Market Oracle is a FREE Daily Financial Markets Analysis & Forecasting online publication.


