


Stacking Up Obama's First 100 Days Stock Market Returns Compared to Past Presidents
Stock-Markets / US Stock Markets May 04, 2009 - 01:06 PM GMTBy: Frank_Holmes

 With President Obama’s first 100 days coming to an end last week, it’s a good time to measure how the market has responded to his initiatives.
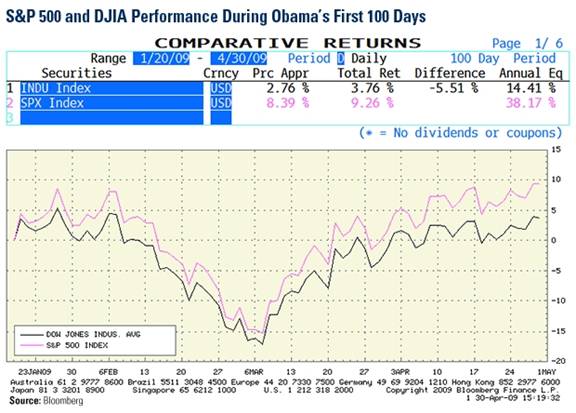
Markets sold off in the weeks following inauguration, reaching a 12-year low for the Dow on March 9. Since then, markets have staged one of the biggest market rallies in history.
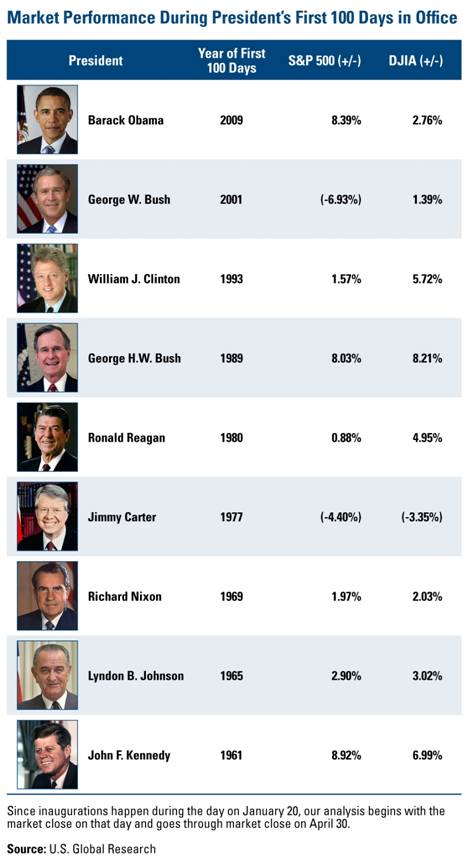
As you can see from the table, the 8.39 percent rise in the S&P 500 during Obama’s first 100 days ranks just behind President Kennedy, who saw a 8.92 percent rise during his.
If you add in dividends paid by S&P 500 companies during Obama’s first 100 days, the total return for the S&P jumps to 9.26 percent.
The average gain during the first 100 days since JFK took office is 3.89 percent for the Dow and 3.63 percent for the S&P 500.
The 6.93 percent drop for the S&P 500 during President George W. Bush’s first 100 days ranks as the worst performer among the group but the Dow managed a 1.39 percent gain during Bush’s first 100 days.
The 8.32 percent discrepancy between the S&P 500 and the Dow during George W. Bush’s first 100 days is by far the largest. On average, there was a 2.83 percent discrepancy between the two.
Jimmy Carter is the only President of the past 50 years to post a negative return for both the S&P 500 and the Dow during his first 100 days in office.
A recent Barron’s story said that of the 19 bear markets since 1917, 15 ended in the first or second year of a presidential term. Herbert Hoover was the only President during that time to see the bear market stretch into his fourth year; he wasn’t reelected.
Hirsch’s Presidential Election Cycle theory says that the year following a President’s election will be the weakest in terms of performance.
However, this hasn’t been the case for two recent Presidents. Both Bill Clinton and George H. W. Bush had strong first years, with the S&P rising 9 percent and 18 percent respectively.
The bounceback for the market has been promising but we’re not out of the woods yet.
Just yesterday we learned America’s economy contracted more than 6 percent during the first quarter of 2009. That’s about three years worth of annual GDP growth in the U.S.
The bright side is we should start to see the effects of the stimulus plan showing up in the economy, which should help buoy the markets during President Obama’s next 100 days.
By Frank Holmes, CEO , U.S. Global Investors
Frank Holmes is CEO and chief investment officer at U.S. Global Investors , a Texas-based investment adviser that specializes in natural resources, emerging markets and global infrastructure. The company's 13 mutual funds include the Global Resources Fund (PSPFX) , Gold and Precious Metals Fund (USERX) and Global MegaTrends Fund (MEGAX) .
More timely commentary from Frank Holmes is available in his investment blog, “Frank Talk”: www.usfunds.com/franktalk .
Please consider carefully the fund's investment objectives, risks, charges and expenses. For this and other important information, obtain a fund prospectus by visiting www.usfunds.com or by calling 1-800-US-FUNDS (1-800-873-8637). Read it carefully before investing. Distributed by U.S. Global Brokerage, Inc.
All opinions expressed and data provided are subject to change without notice. Some of these opinions may not be appropriate to every investor. Gold funds may be susceptible to adverse economic, political or regulatory developments due to concentrating in a single theme. The price of gold is subject to substantial price fluctuations over short periods of time and may be affected by unpredicted international monetary and political policies. We suggest investing no more than 5% to 10% of your portfolio in gold or gold stocks. The following securities mentioned in the article were held by one or more of U.S. Global Investors family of funds as of 12-31-07 : streetTRACKS Gold Trust.
Frank Holmes Archive |
© 2005-2022 http://www.MarketOracle.co.uk - The Market Oracle is a FREE Daily Financial Markets Analysis & Forecasting online publication.