


Is the Financial Crisis Really Over?
Stock-Markets / Credit Crisis 2009 May 11, 2009 - 06:32 PM GMTBy: John_Mauldin

 It has long been my contention that we are entering an extraordinary period of time in which using historical analogies to plot market behavior is going to become increasingly problematical. In short, the analogies, the past performance if you will, all break down because the underlying economic backdrop is unlike anything we have ever seen. It makes managing money and portfolio planning particularly challenging. Traditional asset management techniques just simply may not work. Buy and hope strategies may be particularly difficult to navigate.
Part of the reason we are co challenged in our outlook is that we are experiencing a deleveraging on a scale in the world that is absolutely breath-taking in its scope. And to balance that, governments are going to have to issue massive amounts of sovereign debt to deal with their deficits. But who will buy it, and at what price? And in which currency? This week's Outside the Box gives us some very basic data points that illustrate the challenge very well. But the problem is that even though we can see the challenge, it is not clear what the final outcome will be, other than stressful volatility as the market reacts.
This week's OTB is by my good friends and business partners in London, Niels Jensen and his team at Absolute Return Partners. I have worked closely with Niels for years and have found him to be one of the more savvy observers of the markets I know. You can see more of his work at www.arpllp.com and contact them at info@arpllp.com.
John Mauldin, Editor
Outside the Box
The $33,000,000,000,000 Question
The Absolute Return Letter - May 2009
"Never in the history of the world has there been a situation so bad that the government can't make it worse." -Unknown
Is the Crisis Really Over?
Commercial paper spreads have come down dramatically. Libor rates are (hmm - almost) back to normal. Even high yield spreads are narrowing. It certainly appears as if the credit crisis is well and truly over or, at the very least, the light which most of us think we can see at the end of the tunnel is no longer that of an oncoming freight train.
No wonder equities are currently enjoying one of their best spells ever. And while equities continue to go up and up, most of us are left scratching our heads. Is this the real thing or will it go down in history as 'just' another bear market rally? Not so long ago, the entire financial system stared Armageddon in the face. Now, only a few months later, equity markets behave as if all the worries of yesterday have been washed away. How is that possible?
The Great Bank illusion
The current bull market began in earnest in the second week of March, but what really got everyone going were the surprisingly good Q1 US bank earnings which were reported during the first half of April. Most commentators interpreted the numbers as the clearest piece of evidence yet that we are now firmly on the road to recovery.
Of course US banks made good money in Q1. The environment created for them is the equivalent of the US government reducing the cost of goods to zero for its embattled car manufacturers and then going on to buy - courtesy of the US tax payer - a couple of million cars that nobody really needs. Even Detroit would make money given those conditions!
Liquidity is trapped
The problem for the rest of us is that the banks are not sharing the candy they have been handed. Much of the liquidity created by the central banks remains trapped in the financial sector (see chart 1). Quite simply, the multiplier is not doing its job, as many banks prefer to hoard cash rather than increase lending at this juncture.
This is both good and bad news at the same time. Good because it implies that we probably do not have to worry too much about the inflationary effect of the aggressive monetary easing currently taking place; bad because it means that the economy is not going to kick back to life as quickly as everyone would like – and expect.
Meanwhile investors are growing cautiously optimistic about the GDP outlook for the second half of the year with many now forecasting modest growth – at least in the United States. Only a fool would suggest that GDP would shrink by 5-10% per quarter in perpetuity, as has been the case over the past two quarters. The economic slowdown is now decelerating and, as I pointed out last month, there are good reasons why we may see a temporary lift in economic activity later this year, but it will almost certainly prove transitory.
We are still in a bear market
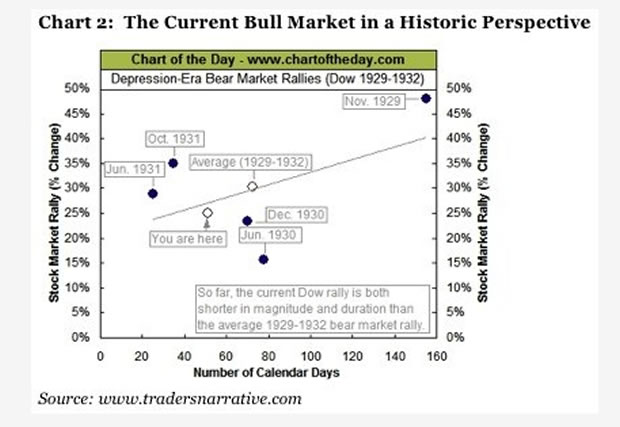
The dangerous conclusion to draw from the experience of the past few weeks is that all is now well and dandy and it is time to load up on stocks again. I cannot emphasize it strongly enough: The bull market of March-April 2009 is almost certainly a bear market rally but, as one of my partners pointed out the other day, NYSE saw four 20%+ rallies between 1929 and 1932 (see chart 2). Bear market rallies can be extremely powerful and hence deceiving.
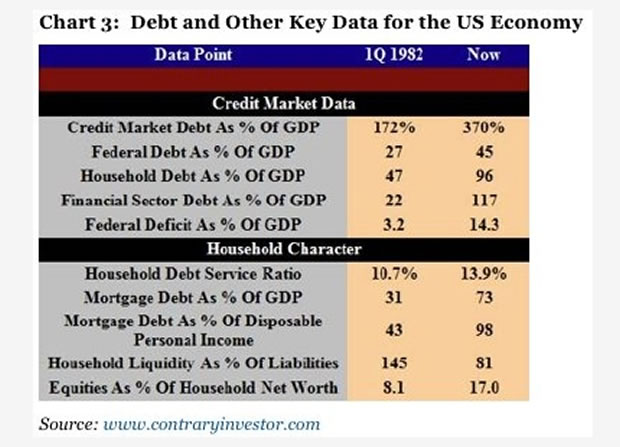
The problems are not over yet. Not by a long stretch. It will take longer than 18 months to unwind the excesses of the past 25 years. Analysts at Morgan Stanley reckon that the 15 largest banks which between them have shrunk their balance sheets by about $3,600 billion so far in this crisis, will shed another $2,000 billion in 20091. If you do not share my pessimism, please take a quick look at chart 3 below. The US financial sector debt load (as a % of GDP) is now 117%. In the early days of the great bull market in 1982, the same number was 22%. Households are not much better off with total household debt now at 96% of GDP vs. 47% in 1982.
Further write-offs to come
The IMF reckons that both European and US banks - but in particular the European ones - are well behind the curve in terms of recognizing their credit crunch related losses. According to the IMF, there is at least another $1,500 billion to come. So when the US banks reported surprisingly good numbers for Q1 it was certainly not because the economy had suddenly and miraculously revived itself, but because some of the oldest tricks in the book were used to gloss over much bigger problems2.
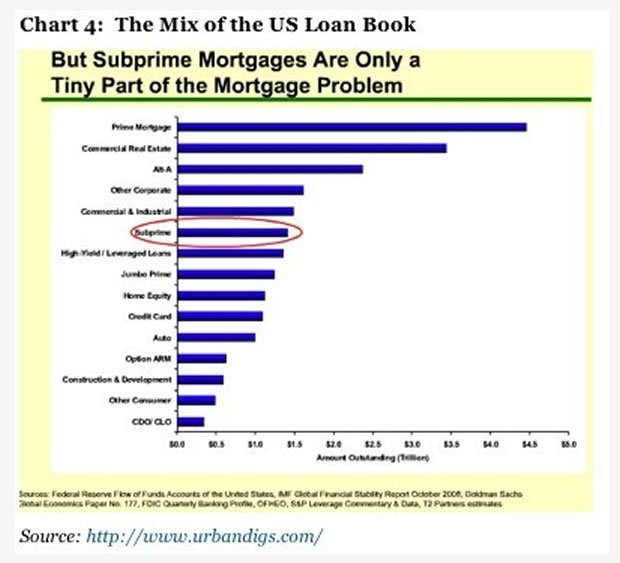
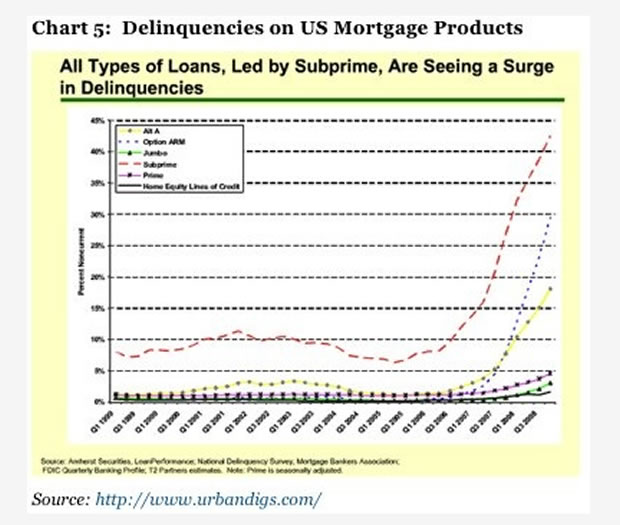
As the recession bites into the lives of ordinary people, banks will face losses not only on sub-prime mortgages but on all loan products. As you can see from chart 4, sub-prime is indeed a small fraction of the total loan book for the US banking sector.
Delinquencies are on the rise
And that is precisely what is beginning to happen as illustrated in chart 5. Delinquencies are now on the rise on all mortgage products; however, whereas sub-prime started to deteriorate as early as 2007, it is only recently that delinquencies related to Alt-A and adjustable rate mortgages have taken off, and prime and jumbo loans are only now starting to suffer.
These are all temporary problems, though, however bad they may appear. By far my biggest concern at the moment is the enormity of the debt problem facing most OECD countries. In the March issue of the Absolute Return Letter I referred to an important study conducted by Carmen Reinhart and Kenneth Rogoff back in December of last year3 which I would like to re-visit (see chart 6).
Banking Crises Run and Run
Reinhart and Rogoff studied every banking crisis of the past generation and made some startling observations. One in particular caught my attention. It has to do with the subsequent rise in government debt which, according to Reinhart and Rogoff, has been "... a defining characteristic of the aftermath of banking crises for over a century". According to the authors, governments inevitably underestimate the ultimate cost of a banking crisis, because the indirect costs (such as falling tax revenue in subsequent years) end up much higher than predicted.
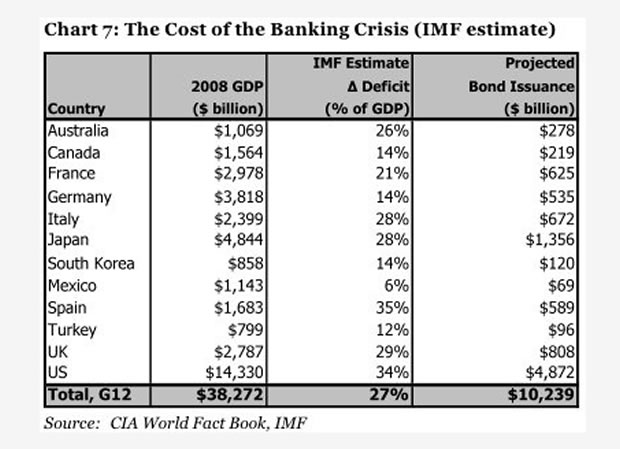
The IMF estimates that the cost of the current crisis to the United States will eventually reach 34% of GDP or close to $5 trillion. However, the Obama administration, through its various implicit and explicit guarantees, is already using a number close to $9 trillion4. And Reinhart and Rogoff's historical average of 86% of GDP implies an ultimate cost of over $12 trillion!
The IMF is too optimistic
I have a lot of respect for all the good work being produced by the people at the IMF; however, they are sometimes too politically correct for my taste; maybe too afraid of stepping on someone's toes. So when they go public, as they did recently, with an estimate of how much the current crisis would ultimately cost, their projection will more than likely prove hopelessly inadequate.
The true cost is important, because it has to be financed through new bond issuance, and it is my thesis that the sheer size of this tsunami will eventually overwhelm the world's bond markets. As you can see from chart 7, using the official IMF estimates, the twelve most industrialised of the world's G20 countries (in my book known as the Dirty Dozen) will have to issue about $10 trillion worth of new bonds to cover the cost of the current crisis.
The Final Cost Will be Enormous
However, if you (like me) believe that IMF underestimates the true cost of this crisis, Reinhart and Rogoff offer a more realistic approach (see chart 8). Using their least costly case study (Malaysia 1997) as our best case scenario, the true cost comes to $15 trillion. If one uses the average of 86% instead, the cost jumps to a whopping $33 trillion. I didn't even bother to produce a worst case scenario - it all got too depressing!
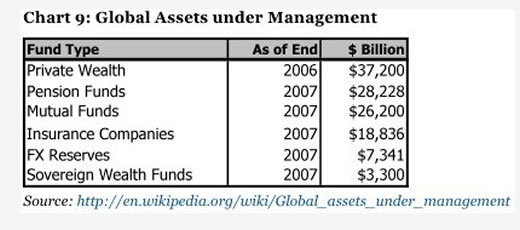
I need to put the $33 trillion into perspective, because it is so big that it is almost incomprehensible. According to Wikipedia (see chart 9), total private wealth across the world today is about $37 trillion less the losses incurred in 2007-09, so the real number is probably closer to $30 trillion now. Total global savings (loosely adjusted for the big losses in 2008) are probably somewhere in the region of $100 trillion. In other words, financing this crisis could absorb one-third of total global savings. No wonder Gordon Brown looks tired!
Where do we find the money?
Obviously, governments may buy a portion of these bonds themselves, but they cannot afford more than a fraction of the total unless they want to challenge Mugabe as the ultimate master of illusion. Neither should investors hold out for sovereign wealth funds to do the dirty work. As is clear from chart 9, the total amount of wealth accumulated in these funds is pocket money when compared to the projected bond issuance over the next few years.
Hence it comes down to the price at which governments can attract sufficient demand from people like you and me. One of two things may happen. Either this crisis will ignite such a bout of deflation that investors will happily own government bonds yielding 2-3% or the deflation scare goes away ultimately, the global economy recovers and bond investors demand much higher yields for taking sovereign risk. I am not yet sure which scenario will prevail, but I do know that both are quite bad for equities longer term. Take your profits!
Niels C. Jensen
1 "Doomsday is on hold but banks will still feel further pain", The Financial Times, 30th April, 2009.
2 In particular one US accounting rule change (FASB rule 160) explains a large part of Q1 profits.
3 "The Aftermath of Financial Crisis", Carmen Reinhart & Kenneth Rogoff, December 2009.
4 http://zerohedge.blogspot.com/2009/04/bail-out-for-dummies-part-1.html
By John Mauldin
John Mauldin, Best-Selling author and recognized financial expert, is also editor of the free Thoughts From the Frontline that goes to over 1 million readers each week. For more information on John or his FREE weekly economic letter go to: http://www.frontlinethoughts.com/learnmore
To subscribe to John Mauldin's E-Letter please click here:http://www.frontlinethoughts.com/subscribe.asp
Copyright 2008 John Mauldin. All Rights Reserved
John Mauldin is president of Millennium Wave Advisors, LLC, a registered investment advisor. All material presented herein is believed to be reliable but we cannot attest to its accuracy. Investment recommendations may change and readers are urged to check with their investment counselors before making any investment decisions. Opinions expressed in these reports may change without prior notice. John Mauldin and/or the staff at Millennium Wave Advisors, LLC may or may not have investments in any funds cited above. Mauldin can be reached at 800-829-7273.
Disclaimer PAST RESULTS ARE NOT INDICATIVE OF FUTURE RESULTS. THERE IS RISK OF LOSS AS WELL AS THE OPPORTUNITY FOR GAIN WHEN INVESTING IN MANAGED FUNDS. WHEN CONSIDERING ALTERNATIVE INVESTMENTS, INCLUDING HEDGE FUNDS, YOU SHOULD CONSIDER VARIOUS RISKS INCLUDING THE FACT THAT SOME PRODUCTS: OFTEN ENGAGE IN LEVERAGING AND OTHER SPECULATIVE INVESTMENT PRACTICES THAT MAY INCREASE THE RISK OF INVESTMENT LOSS, CAN BE ILLIQUID, ARE NOT REQUIRED TO PROVIDE PERIODIC PRICING OR VALUATION INFORMATION TO INVESTORS, MAY INVOLVE COMPLEX TAX STRUCTURES AND DELAYS IN DISTRIBUTING IMPORTANT TAX INFORMATION, ARE NOT SUBJECT TO THE SAME REGULATORY REQUIREMENTS AS MUTUAL FUNDS, OFTEN CHARGE HIGH FEES, AND IN MANY CASES THE UNDERLYING INVESTMENTS ARE NOT TRANSPARENT AND ARE KNOWN ONLY TO THE INVESTMENT MANAGER.
John Mauldin Archive |
© 2005-2022 http://www.MarketOracle.co.uk - The Market Oracle is a FREE Daily Financial Markets Analysis & Forecasting online publication.
Comments
|
Dawood
04 Aug 09, 10:56 |
!!
Nice article! If you'd like to know when experts anticipate the end of financial crisis check this link below: |