


Gold Trust ETF (GLD) Looking to Rally
Commodities / Gold & Silver Stocks May 15, 2009 - 05:49 PM GMT

 Gold – it is the yellow precious metal once used as a primary form of currency for thousands of years. It is durable, liquid and almost indestructible. Historically, investors have fled unstable markets in search of reliable sources of value and stability, which can generally be achieved by investing in this precious metal. For those who want cost efficient access to the gold market, investing in the SPDR Gold Trust Exchange Traded Fund (GLD) is one of the easiest means of doing so. It is the world’s largest gold-backed ETF that offers risk takers a chance to profit by establishing a position in an investment vehicle that has somewhat of an inverse relationship to the equity markets.
My role here today is to analyze the recent movements of GLD and offer my own insights as to what I believe will happen next with regards to price activity. In the chart below, I’ve drawn a thick horizontal line.
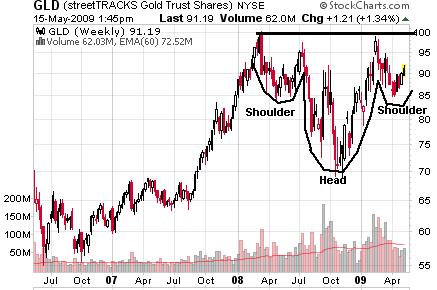
This represents major resistance. The psychological barrier near $100 should come as no surprise seeing that investors gravitate to price figures ending in either “0” or “5”. At any rate, this wall has been tested quite a few times. Instead of tripping over themselves in full retreat, the bulls gave ground to affirm the previous breakout neat $70 and bounced back to test $100/share once more.
The bullish formation that materialized as a result of this back and forth activity is known as a “reverse or inverted head and shoulders” technical pattern. I’ve marked both shoulders along with the head to help visualize this concept. For a quick reference on these setups you can click here. Technical analysis will not guarantee that the end result is bullish, but merely points to the fact that historically, this particular formation should be watched closely for a breakout to the upside.
Where will the breakout occur?
Remember when I said something about a “wall” or “major resistance” currently existing near $100; well that’s where we’ll focus our energies. I fully expect a re-test of the $100/share mark. If GLD breaks out to the upside on above average volume, the index could tack on $30, or even $45 if we’re lucky, eventually carrying the price of this index to somewhere between $130-$145/share. If there isn’t a breakout and the index succumbs to the pressures of previous resistance, then all bets are off until the bulls step back in and attempt to crack the upper ceiling once again.
Now, since this is a multi-year weekly chart, we are not likely to see any major developments for a few months. But I can assure you that there is money to be made if you keep this ETF on your radar during the summer. We’ll revisit this when it’s time to the pull the trigger.
Good investing,
Stanley Barnes
Analyst, Oxbury Research
Disclosure: no positions
Oxbury Research originally formed as an underground investment club, Oxbury Publishing is comprised of a wide variety of Wall Street professionals - from equity analysts to futures floor traders – all independent thinkers and all capital market veterans.
© 2009 Copyright Oxbury Research - All Rights Reserved
Disclaimer: The above is a matter of opinion provided for general information purposes only and is not intended as investment advice. Information and analysis above are derived from sources and utilising methods believed to be reliable, but we cannot accept responsibility for any losses you may incur as a result of this analysis. Individuals should consult with their personal financial advisors.
Oxbury Research Archive |
© 2005-2022 http://www.MarketOracle.co.uk - The Market Oracle is a FREE Daily Financial Markets Analysis & Forecasting online publication.