


The California Housing Report: Details In the Data Show A Broad-based Price Decline
Housing-Market / US Housing May 28, 2007 - 12:34 AM GMTBy: Jas_Jain

Headline: "C.A.R. [California Association of Realtors] reports sales decrease 27.8 percent in April, median price of a home in California at $597,640, up 6.2 percent from year ago." Then we also read, "Throughout the state inventory levels have increased to their highest levels in recent years..."
Price increase in the climate of declining sales and rising inventory? Something doesn't add up.
The report does provide some clue: "Although the median price of a home in California continues to rise, this reflects the fall-off in sales in the lower-priced markets of the state..." The phenomenon mentioned in the last sentence is noteworthy and the gain in the "medina price" reported for the state, as well as in some counties, masks the reality of broad-based price declines if one wanted to know what is happening to the price of the same home compared to last year or the past two years.
When it comes to any economic data series it is very important to keep in mind as to what is being measured and how. If ever there was truth in the adage - The Devil Is In the Details - what is happening to the home prices in California is a good substantiation of that. When things don't add up it pays to look carefully. And I have.
I will endeavor to show that there are three factors that result in overstatement of the median price of resale homes because the characteristics of the median priced home are not the same as the median priced home sold a year, or two years, ago:
1. The size of the homes being sold recently is larger compared to those sold last year.
2. The area mixture of the homes sold recently is significantly different from those of the year ago whether we look within the state or within the counties where the median price shows YoY gains. The rapidly increasing gap between the Haves and Have-nots in the US shows up very clearly in the latest California home sales data.
3. The modernization (or home improvements in layman's term) of the homes sold recently is significantly greater than that of year, or two years, ago.
I plan to support the first two with the hard data and for #3 one can rely on media reports and anecdotal evidence that suggest that sellers are making lot more improvements in order to sell homes today even in areas where sales are strong, e.g., Palo Alto, because the sellers want to increase their chances in a slow sales environment.
Let us begin with a cursory, under-the-hood, look at the prices in various counties as shown in Table 1.
| Table 1: Analysis of Median Price Data From DataQuick (All Homes) For CA | |||||
| COUNTY | Peak Price |
Peak Price Month |
Price Apr-07 |
Price Chg From 2005-06 PEAK |
Price Chg YoY |
| Total = 32 | % | % | |||
| Alameda County | $613,000 | Jun-06 | $591,000 | 3.6 | 2.3 |
| Contra Costa County | $600,000 | Apr-07 | $600,000 | 0.4 | 4.3 |
| El Dorado County | $526,750 | Mar-06 | $422,250 | 19.8 | 15.6 |
| Fresno County | $306,000 | Jun-06 | $280,000 | 8.5 | 6.9 |
| Kern County | $285,000 | Sep-06 | $265,000 | 7.0 | 3.1 |
| Los Angeles County | $540,000 | Mar-07 | $540,000 | 2.9 | 5.5 |
| Madera County | $325,000 | Mar-06 | $288,750 | 11.2 | 6.6 |
| Marin County | $925,000 | Apr-07 | $925,000 | 9.5 | 10.2 |
| Merced County | $380,000 | Dec-05 | $314,000 | 17.4 | 16.3 |
| Monterey County | $622,250 | Feb-06 | $581,500 | 6.5 | 4.2 |
| Napa County | $665,750 | Sep-05 | $559,000 | 16.0 | 7.5 |
| Nevada County | $501,000 | Apr-06 | $475,000 | 5.2 | 5.2 |
| Orange County | $643,000 | Jul-06 | $630,000 | 2.0 | 0.5 |
| Placer County | $515,500 | Aug-05 | $446,000 | 13.5 | 5.6 |
| Riverside County | $435,000 | Dec-06 | $410,000 | 5.7 | 1.0 |
| Sacramento County | $390,000 | Nov-05 | $345,000 | 11.5 | 6.8 |
| San Benito County | $620,000 | Jul-05 | $587,000 | 5.3 | 4.6 |
| San Bernardino County | $380,000 | Nov-06 | $370,000 | 2.6 | 2.8 |
| San Diego County | $525,000 | Mar-06 | $495,000 | 5.7 | 3.9 |
| San Francisco County | $790,000 | Jun-06 | $790,000 | 0.0 | 1.8 |
| San Joaquin County | $441,000 | Jun-06 | $397,000 | 10.0 | 9.0 |
| San Luis Obispo County | $581,000 | Jun-06 | $530,000 | 8.8 | 3.7 |
| San Mateo County | $804,000 | Apr-07 | $804,000 | 4.4 | 6.5 |
| Santa Barbara County | $605,000 | Oct-06 | $580,000 | 4.1 | 15.9 |
| Santa Clara County | $715,000 | Apr-07 | $715,000 | 2.9 | 5.6 |
| Santa Cruz County | $725,000 | Oct-05 | $679,500 | 6.3 | 2.8 |
| Solano County | $476,000 | Jun-06 | $428,000 | 10.1 | 7.0 |
| Sonoma County | $580,000 | Sep-05 | $515,000 | 11.2 | 9.1 |
| Stanislaus County | $392,000 | Feb-06 | $350,000 | 10.7 | 7.9 |
| Tulare County | $269,750 | Dec-06 | $252,000 | 6.6 | 4.0 |
| Ventura County | $620,000 | Jun-06 | $572,000 | 7.7 | 3.0 |
| Yolo County | $500,000 | Jan-06 | $420,250 | 16.0 | 0.7 |
| Median | 6.6 | 3.4 | |||
| Average | 6.7 | 2.4 | |||
| Counties With Double-Digit Declines Since 05-06 Peak | 11 | ||||
| Counties With Peak In 2005 | 7 | ||||
| Counties With Peak In 2006 | 20 | ||||
| Counties With Peak In 2007 | 5 | ||||
As much as there is lot of red ink in Table 1 it does not tell the true story of the real price declines because it does not tell you what were the characteristics of the median-priced homes sold this year versus the median-priced homes sold last year in any of the counties. I will try to show that the price decline might be understated by 10-15% if one were to keep the characteristics constant, i.e., apples-to-apples comparison!
It is abundantly clear from the above table that YoY price gains, as well as new price peaks, are concentrated in LA County and four of the SF Bay Area counties, where a higher percentage of state's Haves (top 5% income households) live (shown in gold). What is happening in Santa Clara County, a proxy for Silicon Valley, tells the story of all the areas with YoY price gains very well and I happen to keep detailed data for the county so I will make my case by providing these details.
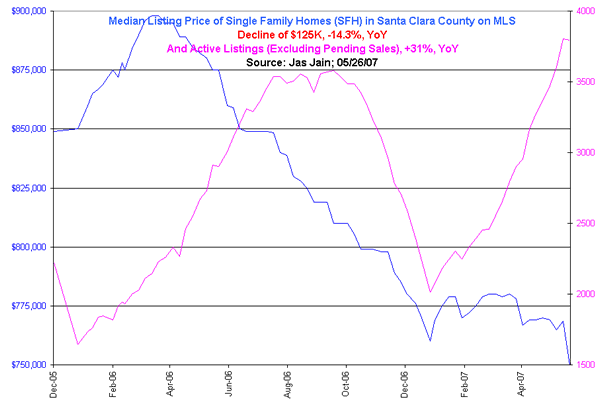
The figure above tells a very different story of Santa Clara County housing than the one told by YoY price gain in the median price of homes sold as well as new all-time high in the price reported for April 2007. The serious decline in the listing price shown above is consistent with the steady rise in inventory for the past two years if one keeps seasonality in mind. Believe it or not the median price of the Active Listings (excluding Pending Sales) hit a multi-year low of $750,000 on the morning of 05/26/07. The high of $898,000 was reached during March 2006. For the past two years we have roughly 150% increase in inventory and 40% decline is sales.
So, why is the reported median price showing YoY gain? Table 2 below provides an immediate clue.
| Table 2: Price & Volume Change (3-Month Median) In High & Low Priced Areas, Santa Clara County |
||||
| Town | Zip Code | Median Price | Median Price YoY Gain |
Median Volume YoY Gain |
| Los Altos | 94022 | $1,805,000 | 12.25% | -4.17% |
| Los Gatos | 95030 | $1,595,000 | 9.54% | 0.00% |
| Los Altos | 94024 | $1,575,000 | -1.47% | 7.69% |
| Palo Alto | 94301 | $1,450,000 | 15.43% | 0.00% |
| Saratoga | 95070 | $1,339,500 | -6.49% | 3.03% |
| Palo Alto | 94306 | $1,244,000 | 21.95% | 7.69% |
| San Martin | 95046 | $1,078,750 | 5.56% | -8.33% |
| San Jose | 95120 | $1,020,500 | 7.82% | 0.00% |
| Los Gatos | 95032 | $1,010,000 | 8.45% | 29.63% |
| Sunnyvale | 94087 | $912,500 | 2.84% | -5.41% |
| Mountain View | 94040 | $900,000 | 37.25% | -17.86% |
| San Jose | 95138 | $899,000 | -3.16% | 7.14% |
| Cupertino | 95014 | $860,000 | -8.51% | 31.48% |
| Mountain View | 94041 | $840,500 | 10.49% | 33.33% |
| Los Gatos | 95033 | $827,750 | -19.86% | 85.71% |
| San Jose | 95129 | $790,000 | 2.76% | -10.00% |
| Morgan Hill | 95037 | $789,500 | 7.88% | -18.92% |
| San Jose | 95125 | $769,500 | 3.33% | -18.10% |
| San Jose | 95148 | $762,500 | 6.79% | -17.65% |
| San Jose | 95135 | $752,500 | 1.42% | -14.29% |
| San Jose | 95117 | $745,000 | 12.43% | 0.00% |
| San Jose | 95130 | $740,500 | -4.96% | 0.00% |
| San Jose | 95124 | $733,000 | 2.65% | -20.55% |
| Santa Clara | 95054 | $730,000 | -9.39% | -9.76% |
| Sunnyvale | 94086 | $721,000 | -0.68% | 20.00% |
| Campbell | 95008 | $701,000 | 0.79% | 1.96% |
| San Jose | 95119 | $698,000 | -2.00% | 0.00% |
| Sunnyvale | 94089 | $692,500 | 4.09% | 122.22% |
| Gilroy | 95020 | $680,000 | 3.03% | -45.00% |
| San Jose | 95132 | $672,500 | 0.00% | -27.27% |
| San Jose | 95118 | $667,250 | 4.13% | -5.13% |
| Mountain View | 94043 | $667,000 | 3.13% | -36.84% |
| San Jose | 95128 | $661,000 | 4.68% | -40.00% |
| Milpitas | 95035 | $659,500 | 8.44% | -32.93% |
| San Jose | 95139 | $657,000 | -1.94% | -40.00% |
| San Jose | 95111 | $625,500 | 8.19% | -28.77% |
| San Jose | 95136 | $625,000 | -9.69% | 25.00% |
| San Jose | 95131 | $624,000 | -9.05% | -38.46% |
| Santa Clara | 95050 | $62,000 | -3.03% | -20.51% |
| San Jose | 95123 | $621,000 | -5.19% | -30.00% |
| San Jose | 95121 | $617,500 | -5.02% | -27.50% |
| San Jose | 95127 | $610,000 | -0.96% | -34.15% |
| San Jose | 95126 | $602,500 | -6.20% | -5.56% |
| Sunnyvale | 94085 | $595,000 | 3.11% | -53.57% |
| San Jose | 95122 | $580,000 | -1.28% | -42.37% |
| Santa Clara | 95051 | $579,000 | -14.86% | -12.70% |
| San Jose | 95112 | $577,000 | -1.29% | -31.71% |
| San Jose | 95110 | $562,500 | 12.50% | -9.52% |
| San Jose | 95134 | $545,000 | -0.93% | 0.00% |
| San Jose | 95116 | $543,000 | 10.57% | -33.33% |
| San Jose | 95133 | $485,000 | -23.43% | -35.00% |
| Median of TOP 1/3rd | $1,010,000 | 7.82% | 0.00% | |
| Median of MIDDLE 1/3rd | $701,000 | 3.03% | -14.29% | |
| Median of BOTTOM 1/3rd | $602,500 | -1.94% | -30.00% | |
The entire decline in sales volume for the past year, some 20%, is concentrated in the zip codes in the bottom 2/3rd as ranked by the median sale price. The homes in the top priced areas are selling briskly and in the bottom priced areas they sit on the market for a very long time. How wide is the gap? Let me quote Richard Calhoun, a Realtor in the area: "Currently, largely because of the sub-prime lender issues, the expensive homes are selling much more rapidly (35 DUI) than the low priced homes (300 DUI). Consequently, the number of listings available on the low-end of the price spectrum is high and listings available on the high-end of the price spectrum are low. The bulk of the median List price drop that you are reporting is a result of the change in the market mix and nothing to do with property values."
I agree with Mr. Calhoun that the "bulk of the median List price drop" is due to the mix of homes that are listed, but part of the price decline shown in the median price of the Active Listings is real, i.e., for the county as a whole the home prices have declined if we compare the same homes in the same areas. This does not mean that there are no zip codes where there is some price appreciation, though only modest.
Now, I will endeavor to estimate how much of the overstatement in the median price is due to the three factors mentioned at the beginning of this report. Table 3 below, based on data published by DataQuick/ San Jose Mercury News, is an attempt at arriving at a figure.
| Table 3: Price Changes Due To Size and Area Mixture Over the Past 43 Weeks, Santa Clara County | ||||||||||
| For the 43 Week Period | ||||||||||
| SANTA CLARA | [Four Weeks] through 05/10/2007 | "Median" SqFt |
Increase In SqFt |
Price Per SqFt Gain Due to Area Mixture |
COMBINED Size Incr & Area Mix |
|||||
| Median Price | Sales Volume | |||||||||
| Community | Price | % Chg* | $/SqFt | # Sold | YoY % | 95W Chg | ||||
| All homes | $710,000 | 4.4% | $477 | 1,855 | -19.9% | -38.8% | 1488 | 2.8% | ||
| Total resale houses | $800,000 | 7.7% | $506 | 1,189 | -19.4% | -42.1% | 1581 | 3.4% | 5.5% | 9.1% |
| Total condominiums | $527,000 | 5.4% | $431 | 413 | -29.4% | -50.9% | 1223 | 5.1% | ||
| Total new homes | $675,500 | 3.9% | 253 | -0.4% | 40.7% | Annual | 4.2% | 6.7% | 11.1% | |
| SANTA CLARA | [Four Weeks] through 7/14/2006 | |||||||||
| Median Price | Sales Volume | |||||||||
| Community | Price | % Chg* | $/SqFt | # Sold | YoY % | |||||
| All homes | $690,000 | 6.2% | $477 | 2,154 | -23.6% | 1448 | ||||
| Total resale houses | $771,500 | 10.2% | $505 | 1,364 | -28.2% | 1528 | ||||
| Total condominiums | $501,500 | 6.7% | $431 | 492 | -30.5% | 1163 | ||||
| Total new homes | $599,000 | -10.7% | 298 | 41.2% | ||||||
The 43-Week period chosen is strictly because I didn't save the data corresponding to the 52-Week change. It is an amazing coincidence that the price per SqFt (PPSF) for all the three categories is nearly identical for the two periods listed in the table. If the median price is up and the PPSF is the same then we reach an easy conclusion that homes sold in all three categories, county wide, are larger today than 43 weeks ago. A more difficult task is to come up with a figure for the increase in the median price due to change in the Area Mixture. Fortunately, with the availability of the PPSF and the volume of sales for each of the zip codes and the fact that the PPSF for all the zip codes combined is the same, for both periods, we can calculate the price change due to Area Mixture by comparing the weighted average price (weighted by % of total sales in a given zip code). This is shown under "Gain Due to Area Mixture." As you can see in the last column the gain in the median price due to Size and Area Mixture is 9.1% for the 43-Week period considered. This annualizes to 11.1%
The contribution of home Modernization to the increase in median sale price can't be estimated from data because I know of no data that is available. My best guess is 2-5% compared to year ago. It is a safe conclusion that the changes in the homes being sold today versus a year ago account for 10-15% gain in the median price. This applies to Santa Clara County, based on the calculations and estimate, but I believe that it reflects what is going on statewide as well as in most counties. The percentage overstatement might differ from county to county and zip code to zip code.
This conclusion does not preclude the probability that there are some zip codes where there is some real home price appreciation. I would estimate the number of these zip codes to be no more than 50 for the state, or to less than 5% of the zip codes. Segregating educational opportunity by zip codes is a neat American trick. I doubt that there is any civilized nation on earth with greater inequality of educational opportunity, K thru12, than in America based overwhelmingly on the income level of the parents. Little wonder that the gap between the Haves and Have-nots keeps increasing. I hope that you understand that these comments have everything to do with home prices.
By Jas Jain, Ph.D.
the Prophet of Doom and Gloom
© 2005-2022 http://www.MarketOracle.co.uk - The Market Oracle is a FREE Daily Financial Markets Analysis & Forecasting online publication.