


Stock Market, What's Next?
Stock-Markets / Stock Index Trading Jul 12, 2009 - 04:06 PM GMTBy: Guy_Lerner

 After being bullish for 9 consecutive weeks and having seen the S&P500 fall some 5% over that time, the "dumb money" has finally given up hope. The "Dumb Money" indicator has moved from a bullish extreme to the neutral zone.
The "Dumb Money" indicator is shown in figure 1. The "Dumb Money" indicator looks for extremes in the data from 4 different groups of investors who historically have been wrong on the market: 1) Investor Intelligence; 2) Market Vane; 3) American Association of Individual Investors; and 4) the put call ratio.
Figure 1. "Dumb Money" Indicator/ weekly
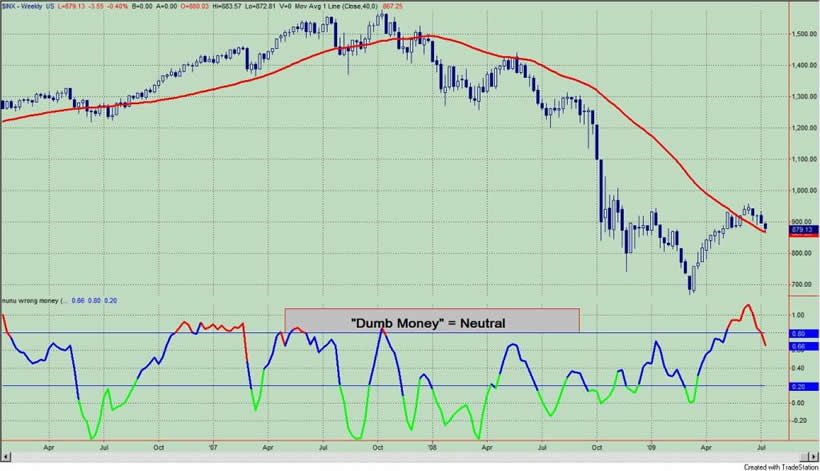
Let's compare the past 9 weeks when sentiment was bullish (i.e., bear signal) with the time period from February 27 to March 20, 2009 (4 weeks) when the "dumb money" was bearish (i.e., bull signal). As we know over the last 9 weeks, the S&P500 has lost ground as "green shoots" turned brown. As we remember from the earlier period, the S&P500 gained a little over 4% before lifting off some 25% higher over the next two months. So this is why I watch investor sentiment.
So what's next for investor sentiment? Unless this turns out to be a bull market (and I have expressed my doubts since the start of the rally on March 9), the most likely course is for the "Dumb Money" indicator to cycle into a bearish extreme (i.e., bull signal) over the next couple of months. And there are only two ways to get more bears: 1) we either have a protracted trading range that wears the bulls down; or 2) we have lower prices.
In the short term, there is always hope for the bulls as prices on the S&P500 remain above the down sloping 40 week moving average and above the key support level at 876. In addition, personal research shows that prices will likely move higher in the week or two after the "Dumb Money" indicator has moved from extremely bullish zone (i.e., bear signal) to neutral as it did this past week. Into this this mini - lift would be the optimal time to sell (if you haven't done so already). Of course, a weekly close below the 876 level and the 40 week moving would be an ominous 1-2 punch for the bullish cause, and certainly reason enough to "get out of Dodge!"
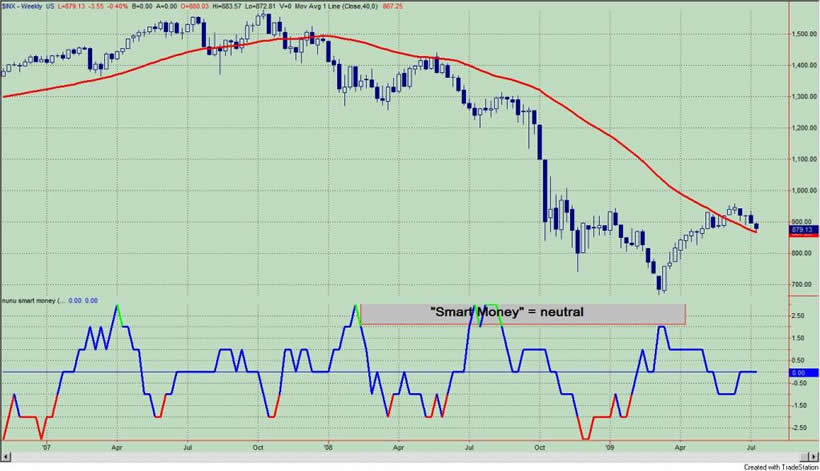
The "Smart Money" indicator is shown in figure 2. The "smart money" indicator is a composite of the following data: 1) public to specialist short ratio; 2) specialist short to total short ratio; 3) SP100 option traders. The "smart money" is neutral.
Figure 2. "Smart Money" Indicator/ weekly
By Guy Lerner
http://thetechnicaltakedotcom.blogspot.com/
Guy M. Lerner, MD is the founder of ARL Advisers, LLC and managing partner of ARL Investment Partners, L.P. Dr. Lerner utilizes a research driven approach to determine those factors which lead to sustainable moves in the markets. He has developed many proprietary tools and trading models in his quest to outperform. Over the past four years, Lerner has shared his innovative approach with the readers of RealMoney.com and TheStreet.com as a featured columnist. He has been a regular guest on the Money Man Radio Show, DEX-TV, routinely published in the some of the most widely-read financial publications and has been a marquee speaker at financial seminars around the world.
© 2009 Copyright Guy Lerner - All Rights Reserved
Disclaimer: The above is a matter of opinion provided for general information purposes only and is not intended as investment advice. Information and analysis above are derived from sources and utilising methods believed to be reliable, but we cannot accept responsibility for any losses you may incur as a result of this analysis. Individuals should consult with their personal financial advisors.
Guy Lerner Archive |
© 2005-2022 http://www.MarketOracle.co.uk - The Market Oracle is a FREE Daily Financial Markets Analysis & Forecasting online publication.