


Weekly Gold and Silver Technical Analysis Report - 10th June 2007 - Technically Precious with Merv
Commodities / Gold & Silver Jun 10, 2007 - 01:20 AM GMTBy: Merv_Burak

WOW! Nibble, nibble, nibble then plunge, plunge. Now what should we expect? Five days of down side, one should expect a few up sides BUT would you put money on that?
GOLD : LONG TERM
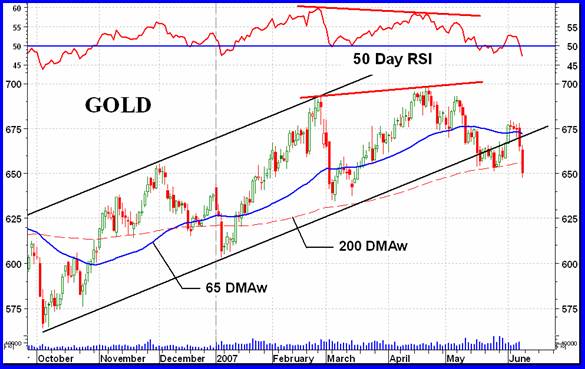
A couple of scary days but we're still a long way away from going bearish on the long term P&F chart. That point is still the $600 level.
As for the normal indicators, Friday the price closed below my weighted long term moving average line although the line is still pointing gently higher. Most analysts use the simple moving average. The price is still above that moving average line but by less than $10. As for the price momentum, that continues to head towards its neutral line but not quite there yet. It is just about at the same level where it was during the $603 January low and zeroing in on its previous lowest low of the past year which was at the October low just before the latest series of rallies started. As for the volume action, the volume indicator is below its trigger line and the line has turned down.
Last week I went back into the bullish camp (from neutral the previous week) and I will remain BULLISH for at least another week. To turn bearish would require a shift in the moving average information and/or a serious drop in momentum.
INTERMEDIATE TERM
The intermediate term P&F chart went bearish a few weeks back and remains so. The projection at that time was to the $605 level and nothing has changed.
That rebound back into the up trending channel didn't last long. A reader suggested that by using a semi-log scale the rebound would not have entered back into the channel. From my data the price would just have poked its head slightly into the channel but not enough to consider it an upside break. This is what technical analysis is all about, you use what works for you and we get different technicians looking at the same data but getting different answers. If we all got the same answer at the same time the markets would be nothing other than sudden sharp moves all the time as hoards of technicians are scrambling to get in or out at the same time. But I start to digress again.
What we see in the chart is what I would refer to as a one day fake-out and then back to the down side. Friday's close got us back into a new low for this latest move. That places the price below a negative sloping moving average line and the price momentum back into the negative territory. Momentum is now lower than its value during the January low and heading towards that October low. As for the volume indicator, that is below its trigger line and the line continues in its negative direction.
Last week, I moved to the + neutral level for the intermediate term. This week's action places me into the BEARISH camp.
SHORT TERM
We've had a couple of sharp sudden reversals since the April top. Maybe we do have a whole bunch of technicians looking at the same data, coming to the same conclusion and jumping in and out at the same time. At least it looks like some group of speculators are doing so.
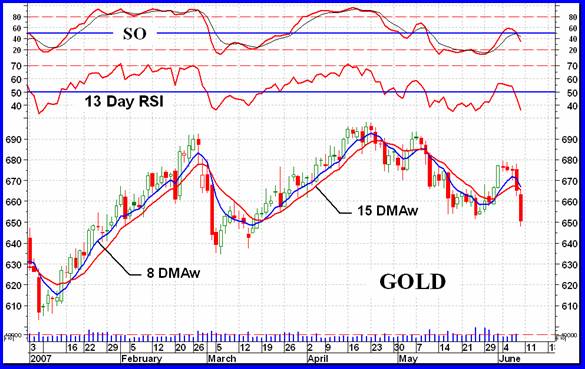
As for the short term, well everything looks like more downside to come, at least that seems to be the direction of least resistance. Just how far down can we expect this trend to take us? My intermediate term P&F projection of $605 seems as good of a location as any. Getting there may not be directly but most likely in a couple of step moves, such as the one this past week. I'm not yet comfortable drawing a short term trend line on this chart so I must rely on the moving average information. With the price below a negative short term moving average line the trend can only be assumed to be downward. The short term momentum is back in its negative zone and pointing lower. It is still above its oversold level so there still is room for more downside. Going with the criteria of going with the trend one can only continue BEARISH on the short term.
IMMEDIATE TERM
As for what to expect over the next day or two, I will also go with the trend here. The Stochastic Oscillator is negative and below its trigger line. The price is below its very short term moving average line. The price is making a new reaction low. All is in place to continue lower, so that's the way I will go. The price action over the past two days has been quite volatile and has not left a good point for a reversal expectation. So, I will just go with a guesstimation and expect that should the price close above the $660 level both the short and immediate term directions have reversed.
NORTH AMERICAN GOLD INDICES
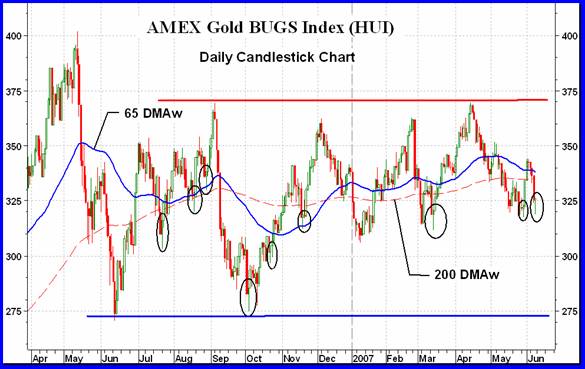
It almost seems like yesterday that we last looked in on the AMEX Gold BUGS Index and here we are again. The Index continues to move within that wide upper and lower band shown on the chart. It's presently at the mid point of the band but at a point where one might imagine it suddenly plunging towards the lower support line. EXCEPT for the Friday action. Despite the sharp sell-off in gold the Index (as well as all the other major Indices) had a rebound during the day and closed on the up side. The Friday's action is what is referred to as a “hammer”. That is a small body on top of a long tail. I have shown several other hammers and “long lower shadows” on the chart. A long lower shadow may be described as a hammer but with a small “wick” at the top like on a CANDLE. These two candlestick patterns are bullish patterns but the big unknown is the expected duration of the projected rally. As you can see, some of these had significant rallies while others were somewhat shot lived. In any case a rally is expected from this level. One should be careful not to project this as an expected rally in gold itself. Follow the gold chart. The two, gold and gold Indices, do not necessarily move together.
MERV'S PRECIOUS METALS INDICES
Disaster, disaster. It was a bad week for the Precious Metals Indices. Only the FTSE Gold Mines AustralAsia Index closed with a good gain on the week. One wonders if this was not solely due to the strength of the Australian dollar (which gained 1.2% versus the US $). As far as North America Indices were concerned, disaster. The average decline in the major Indices was 5 %. The Composite Index declined by 4.0 % which reflects the slightly better performance of most of the Merv's Indices and the FTSE mentioned above (along with the US $).
MERV'S GOLD & SILVER 160 INDEX
The average decline in the universe of 160 stocks was 4.0%, the same as the Composite Index. Although better than the majors, that still does not make one feel any better. There were a full 135 stocks on the down side (84%) with only 20 on the up side (13%). What were the odds that you were one of those on the up side? When we sum up the individual ratings for the component stocks we are back into the bearish side. All three time periods had a summation rating that was a BEAR with the short term at 72%, the intermediate term at 71% and the long term at 62%. This is not the time for a cautious speculator to be in the gold or silver market. Only Gamblers need be in. Despite the sharp drop in gold and the Indices we still do not have a panic. Only one stock was in my over/under 30% weekly move category and that stock received a very nasty court decision against it during the week to precipitate the move.
As far as the chart indicators are concerned, that story is pretty clear here. On the intermediate term the Index is below a negative moving average line and the momentum is in its negative zone and heading lower. BEARISH on the intermediate term
On the long term the Index closed just a hair below its long term moving average line but the line is still pointing upward. Momentum is heading lower but still in the positive zone. I was going to call it bullish but decided that a NEUTRAL rating was more appropriate at this time. Next week should tell us if the long term goes negative or positive.
MERV'S QUAL-GOLD INDEX : MERV'S SPEC-GOLD INDEX : MERV'S GAMB-GOLD INDEX
This is probably the only place that you will find information on the different sectors within the gold stocks. Not all stocks move together, although over a long period they all move in the same direction. The quality stocks, the second tier speculative stocks and the gambling type of speculative stocks may at times diverge quite noticeably.
As could be expected all three sectors lost ground during the week. Once more the losses were in inverse to their “quality”. The Qual-Gold lost 5.2%, the Spec-Gold lost 4.4% and the Gamb-Gold lost only 3.4%. Since their top in April the Qual-Gold has lost 11.5%, the Spec-Gold has lost 9.9% and the Gamb-Gold has lost 7.0%. If this down turn should continue I would expect that the gambling stocks could quite quickly catch up to the “quality” losses but for now the quality lead on the down side.
During the week the advancing versus declining issues were a complete wipe-out. 100% of the Qual stocks closed lower while 93% of the Spec and 87% of the Gamb stocks also closed lower.
Looking at the intermediate term indicators, the Gamb-Gold momentum is still in its positive zone but all other indicators for all three sectors are negative. This puts all three Indices in the BEARISH camp for the intermediate term
On the long term we have a variety of positives and negatives in the indicators resulting in the Gamb-Gold Index being BULLISH, the Spec-Gold Index being – NEUTRAL and the Qual-Gold Index being BEARISH.
Without going into details the summation of individual ratings have all moved further into the negative during the week. The three ratings for the Qual and Spec-Gold Indices are all greater than 80% BEARISH. The ratings for the three Gamb-Gold time periods are BEARISH but in the 60% range.
SILVER
The actions of silver are very much like that of gold, however, despite a greater % loss on the week (it had a greater % gain last week) it has not moved into new low territory for this latest move as gold has done. Another couple of bad days and it too will be there.
MERV'S QUAL-SILVER INDEX : MERV'S SPEC-SILVER INDEX
The Qual-Silver Index closed the week 4.3% lower while the Spec-Silver Index closed 5.5% lower. This looks like a reverse to the gold performance where the Qual was the greater loser but in the Spec-Silver Index one stock alone closed almost 50% lower due to a court decision that went bad. That single stock loss added almost a full 2% points to the negative performance. Without this one stock the Spec-Silver performance would be closer to minus 3.5% and in line with the gold scenario of performances. Since their April tops the Qual-Silver Index has declined 10.2% while the Spec-Silver declined 8.6%.
Looking at the various indicators for the intermediate and long term we have both Indices with BEARISH ratings except for the Spec-Silver long term which is still at a BULLISH rating. As with the gold indices, the overall summation of ratings are all in the BULLISH camp, most with ratings greater than 60%.
MERV'S PRECIOUS METALS INDICES TABLE
Well, I'm calling it another week. Let's see what the next week brings us.
By Merv Burak, CMT
Hudson Aero/Systems Inc.
Technical Information Group
for Merv's Precious Metals Central
Web: www.themarkettraders.com
e-mail: merv@themarkettraders.com
During the day Merv practices his engineering profession as a Consulting Aerospace Engineer. Once the sun goes down and night descends upon the earth Merv dons his other hat as a Chartered Market Technician ( CMT ) and tries to decipher what's going on in the securities markets. As an underground surveyor in the gold mines of Canada 's Northwest Territories in his youth, Merv has a soft spot for the gold industry and has developed several Gold Indices reflecting different aspects of the industry. As a basically lazy individual Merv's driving focus is to KEEP IT SIMPLE .
To find out more about Merv's various Gold Indices and component stocks, please visit www.themarkettraders.com and click on Merv's Precious Metals Central . There you will find samples of the Indices and their component stocks plus other publications of interest to gold investors. While at the themarkettraders.com web site please take the time to check out the Energy Central site and the various Merv's Energy Tables for the most comprehensive survey of energy stocks on the internet. Before you invest, Always check your market timing with a Qualified Professional Market Technician
© 2005-2022 http://www.MarketOracle.co.uk - The Market Oracle is a FREE Daily Financial Markets Analysis & Forecasting online publication.