


Rocky Balboa on Investing
InvestorEducation / Learning to Invest Jul 29, 2009 - 02:38 AM GMTBy: Richard_Shaw

 Rocky Balboa actually never talked about investing, but while preparing for a fight he said ” It ain’t how hard you can hit. It’s how hard you can get hit.”
Those words from a simple man are a simple explanation of part of our approach to investment decisions for those of our clients who have completed the accumulation stage of their financial lives, and now rely on their assets to support lifestyle.
It’s not how much you can gain (or how high the income stream). It’s how much loss you can take emotionally and financially.
The time to think about your loss potential and loss tolerance is before you invest, not after you invest, when you may face adverse price movements.
By whatever means you use to judge gain potential, make sure you also judge loss potential, and weigh one against the other.
Generally, you should be comfortable that the potential gain substantially exceeds the potential loss — being mindful of the probability of gain or loss, as well as the amount of gain or loss.
If you use trailing stop loss orders or mental stops, you can effectively set boundaries on potential losses; but make sure that the stop loss point is outside of the noisy volatility area. There are several tools you can use to chose a stop loss point, some which are more readily accessible than others.
For example, among other methods, you can use prices just below apparent support levels on the chart as possible stop levels; or you can develop stop loss points using the historic volatility of the security, or the implied volatility in the options pricing.
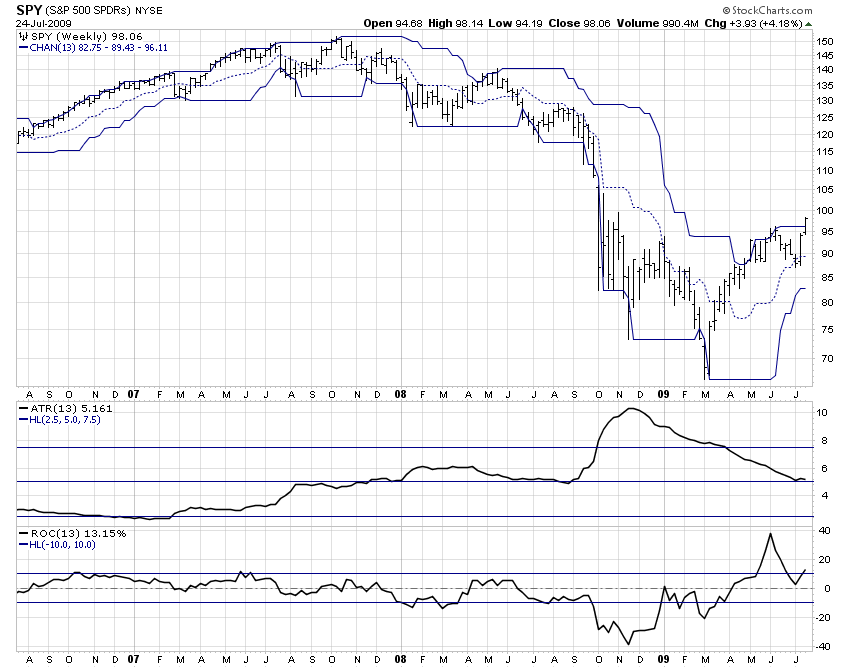
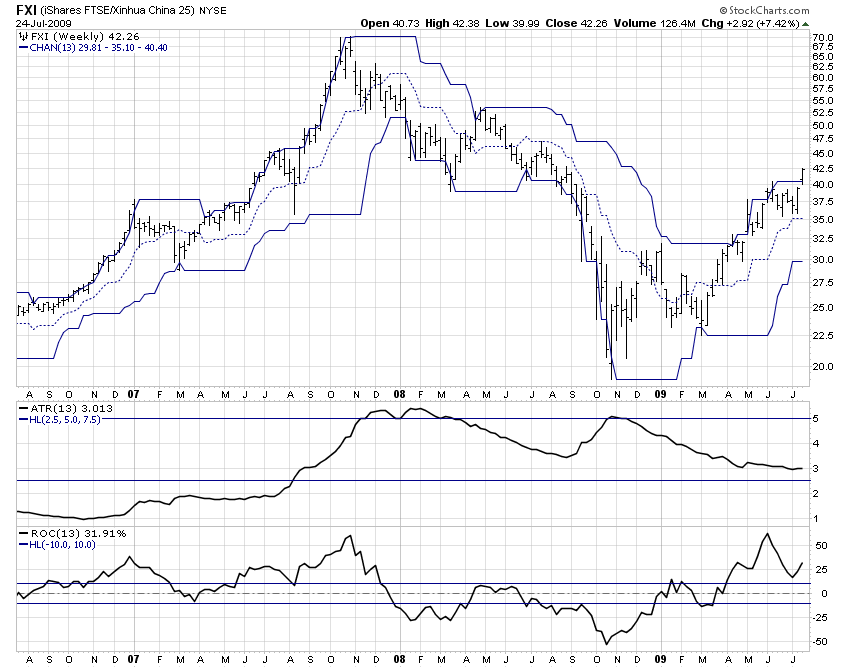
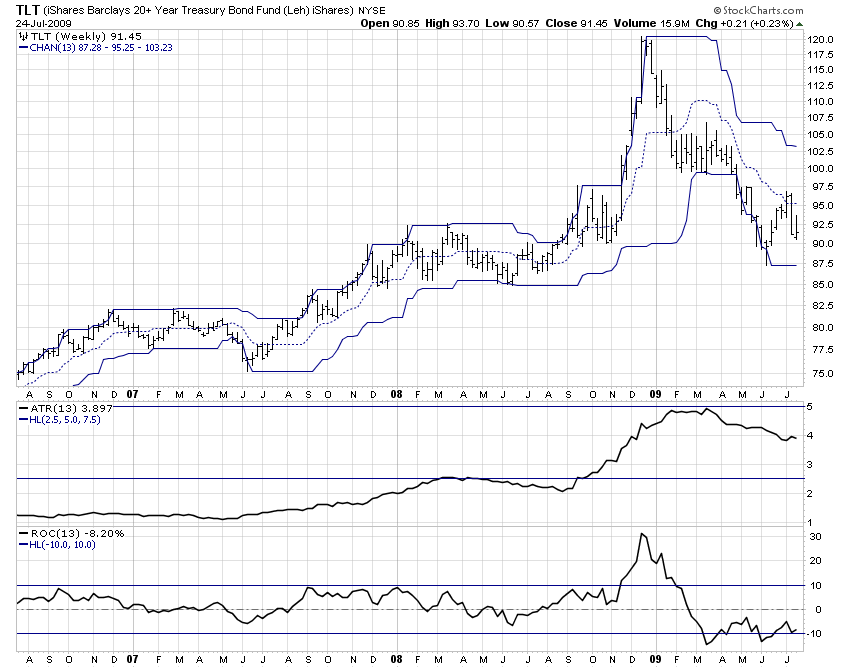
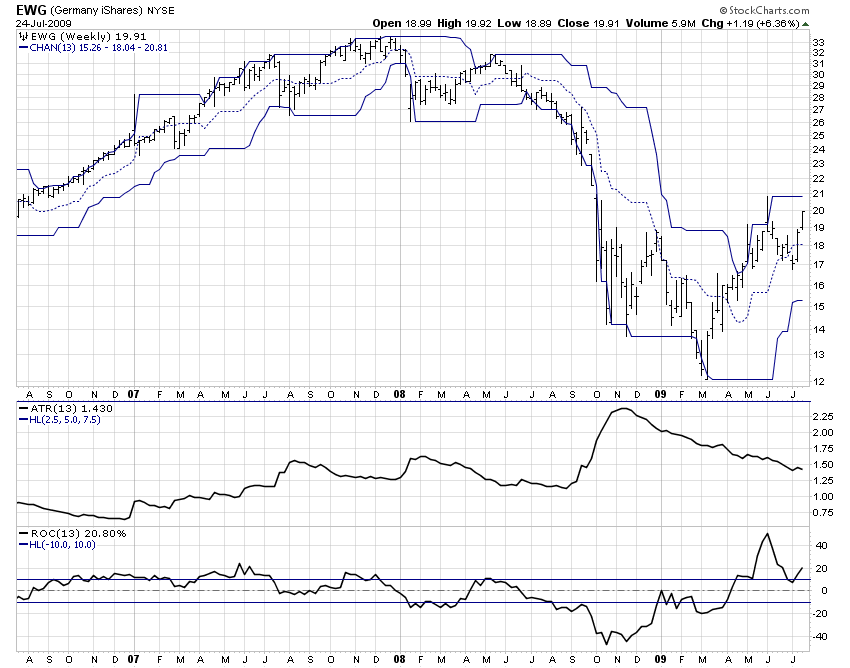
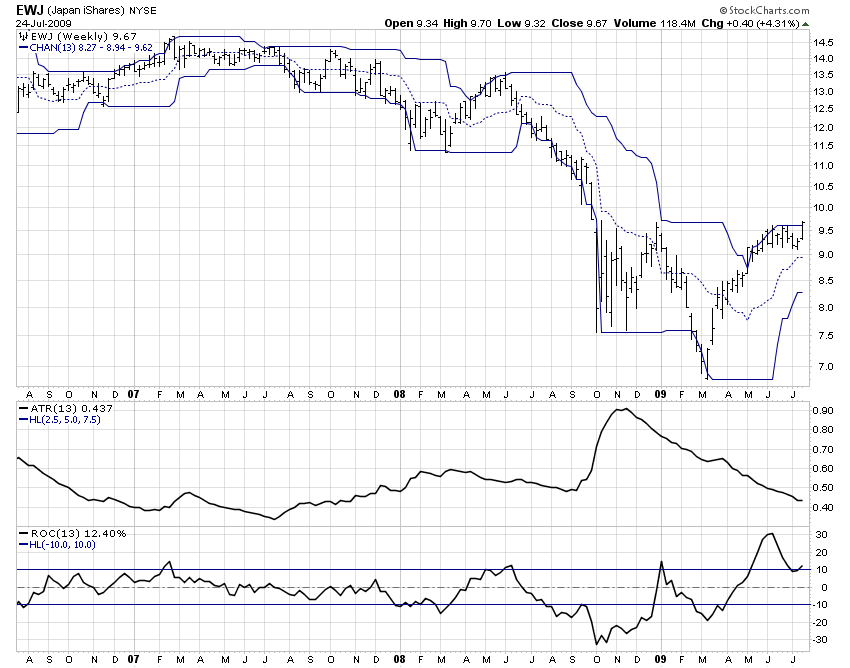
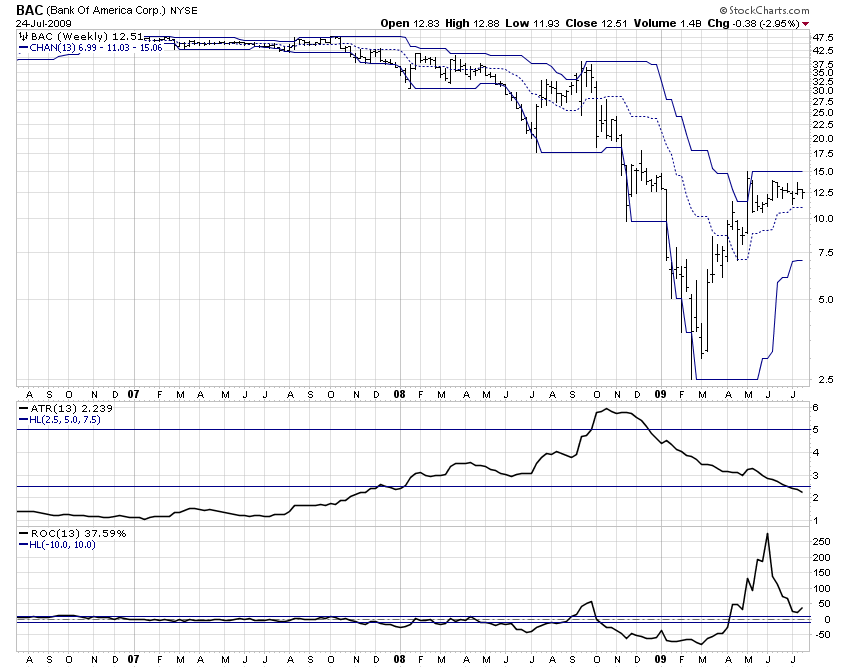
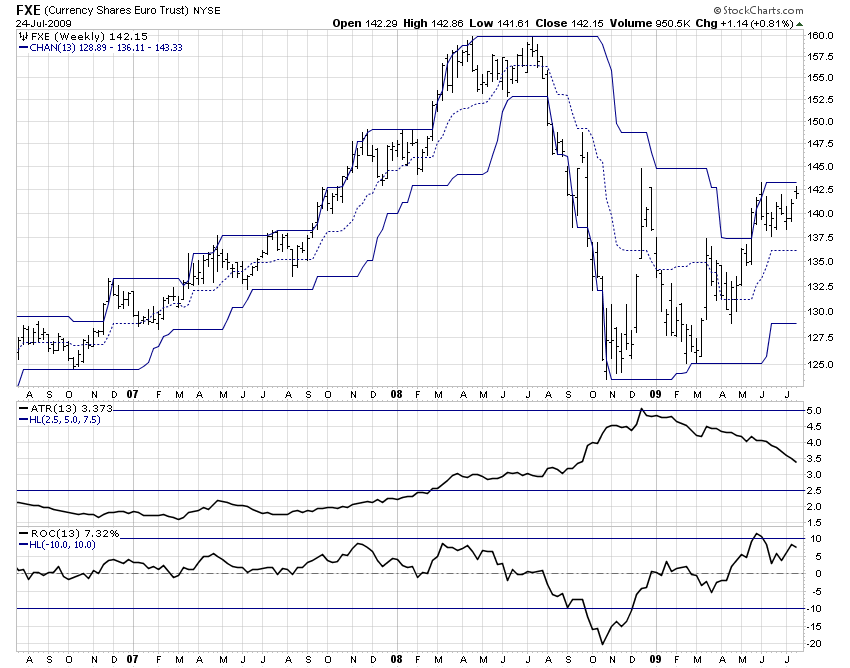
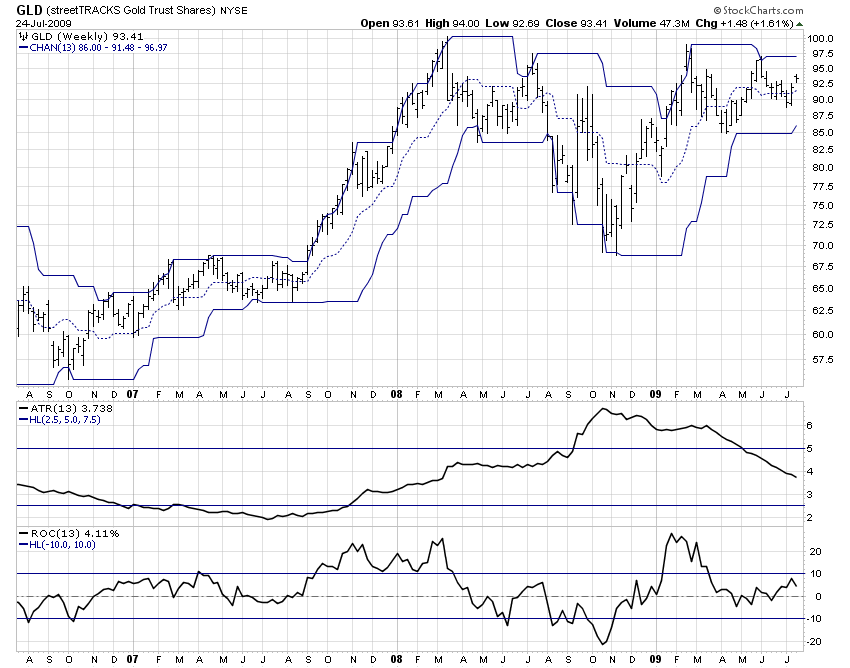
Here are some charts for several different securities using readily available features to help set stop loss points. They show the 13-week price channels, the 13-week rate of change, and the 13-week average true range, each of which might be useful in helping to establish an idea of where the stop loss may need to be to “stay in the game” without too much worry about noise knocking you out of your position. That applies to being knocked out for a loss before your security rises by at least as much as the stop loss amount or percentage, but also to being knocked out after the security has risen and is on its upward path.
With the price channels, you might consider a price just below the lower channel as a stop loss point.
With the rate of change, you might expect that the percentage price fluctuation in the near future could resemble the percentage price fluctuation in the recent past, and chose to use 1.0 to 1.5 times that amount as your stop percentage.
With average true range, you might similarly expect the amount of the price change to fluctuate in the near future in a way similar to the recent past and use a 1.0 to 1.5 multiple of that amount as a Dollar amount of your stop.
Of course any Dollar amount stop could be expressed as a percentage stop, or the other way around. We prefer percentage, because as the price of the security rises the percentage approach maintains the same relationship to the market price as when the position was opened.
An important take away from the charts below is to notice that each security has its own particular behavior pattern, and that a single percentage for all trades is too simplistic. It is also important to realize that the different methods will not produce equal suggestions as to the stop loss. They are just suggestions, not precise calculations or predictions, but considering them is better than considering nothing. In the end, you need to use judgment about your circumstances and the circumstances of each security to set the stop loss parameters.
For those who say stop loss orders are not a good idea, we ask if they wish they had some before October 2008. Even if you don’t use close stops, use catastrophic loss stops.
SPY
FXI
TLT
EWG
EWJ
BAC
FXE
GLD
Securities mentioned in this article: SPY, FXI, TLT, EWG, EWJ, BAC, FXE, GLD
Disclosure: We own some, but not all securities mentioned in this article.
By Richard Shaw
http://www.qvmgroup.com
Richard Shaw leads the QVM team as President of QVM Group. Richard has extensive investment industry experience including serving on the board of directors of two large investment management companies, including Aberdeen Asset Management (listed London Stock Exchange) and as a charter investor and director of Lending Tree ( download short professional profile ). He provides portfolio design and management services to individual and corporate clients. He also edits the QVM investment blog. His writings are generally republished by SeekingAlpha and Reuters and are linked to sites such as Kiplinger and Yahoo Finance and other sites. He is a 1970 graduate of Dartmouth College.
Copyright 2006-2009 by QVM Group LLC All rights reserved.
Disclaimer: The above is a matter of opinion and is not intended as investment advice. Information and analysis above are derived from sources and utilizing methods believed reliable, but we cannot accept responsibility for any trading losses you may incur as a result of this analysis. Do your own due diligence.
Richard Shaw Archive |
© 2005-2022 http://www.MarketOracle.co.uk - The Market Oracle is a FREE Daily Financial Markets Analysis & Forecasting online publication.