


So-Called Fed Model Suggests Housing Market Is Over-Valued
Economics / US Housing Jun 11, 2007 - 07:16 PM GMTBy: Paul_L_Kasriel
 Better late than never, huh? The so-called Fed model is often used to gauge the under-over-valuation of corporate equities by comparing the earnings yield on, say, the S&P 500 with the yield on the Treasury 10-year security. The same kind of analysis can be applied to owner-occupied housing by dividing the "earnings" or services produced by owner-occupied housing by the market value of that housing. The services produced by housing are estimated by the Bureau of Economic Analysis in its National Income and Product Table 2.45U, line item "Personal Consumption Expenditures: Owner-Occupied Nonfarm Dwellings: Space Rent."
The market value of owner-occupied housing is estimate by the Federal Reserve in its Flow-of-Funds Table B.100, line item "Balance Sheet of the Household and Nonprofit Organizations: Assets: Households: Total Owner-occupied Real Estate." Both the nominal "yield" on owner-occupied housing and the nominal yield on Treasury 10-year securities are shown in Chart 1.
Chart 1
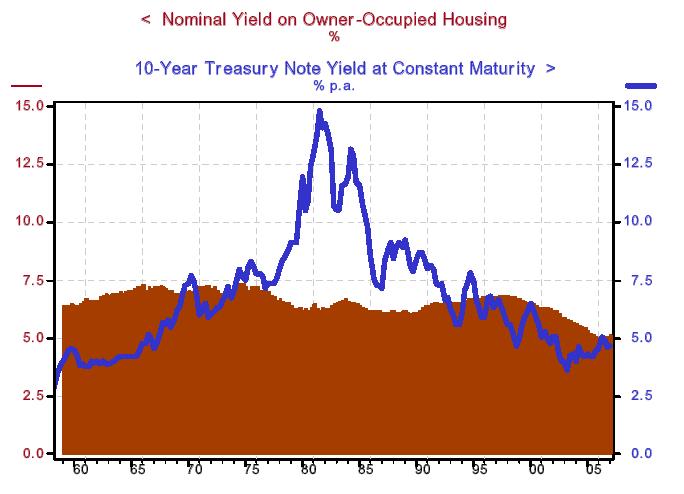
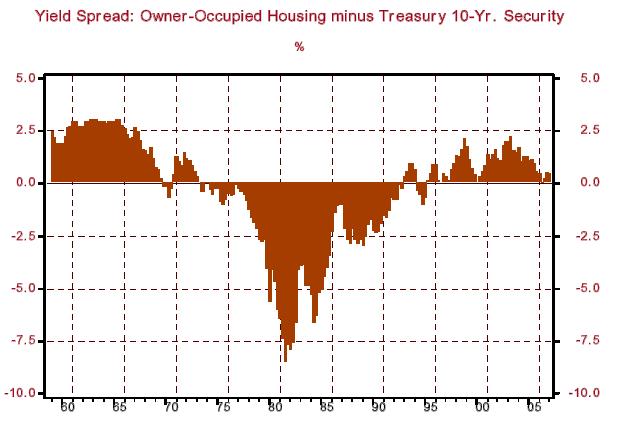
Chart 2 shows the difference in percentage points between the yield on owner-occupied housing and the yield on a Treasury 10-year security. After being slightly negative (3 basis points) in 2006:Q2, the yield on housing was 46 basis points over 10-year Treasuries in 2007:Q1. But that pales in comparison to the annual average positive yield differentials of 115 basis points, 127 basis points, 154 basis points, and 103 basis points in 2001, 2002, 2003 and 2004, respectively. Although hardly news, but the Fed model is just more confirmation that bloom and boom is off the housing rose.
Chart 2
Households: Up To Their Eyebrows in Debt, Down Top Their Ankles in Liquidity
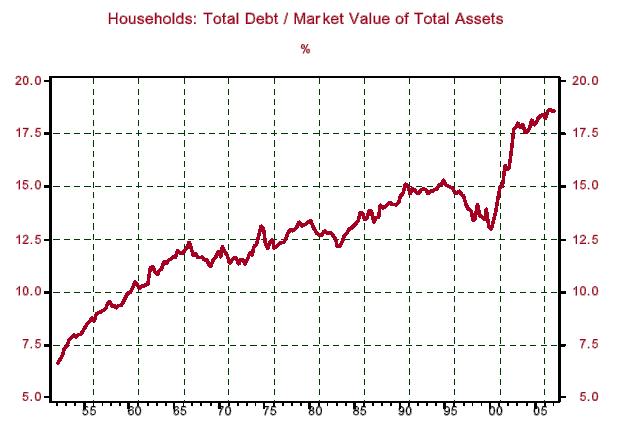
In 2007:Q1, total household debt represented 18.584% of the market value of total household assets - just off the record high of 18.684% set in 2006:Q3 (see Chart 3).
Chart 3
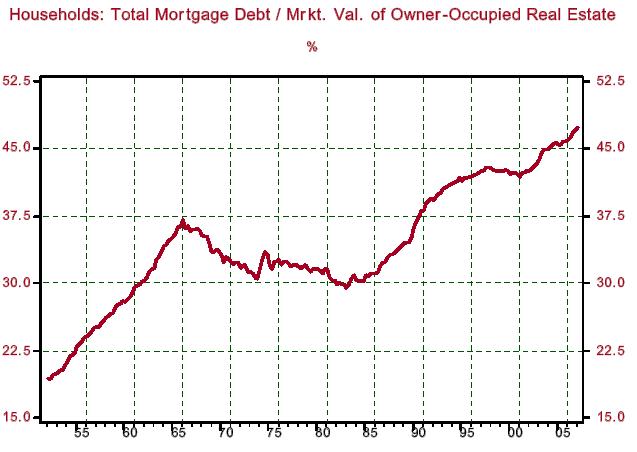
Households' single-largest asset, their houses, is carrying record debt relative to its market value (see Chart 4). I can't confirm it, but conventional wisdom has it that about one-third of all owner-occupied housing has no debt associated with it. If that's case, then with record leverage in housing today, the two-thirds of houses with debt associated with them must have an incredibly high debt-to-value ratio.
Chart 4
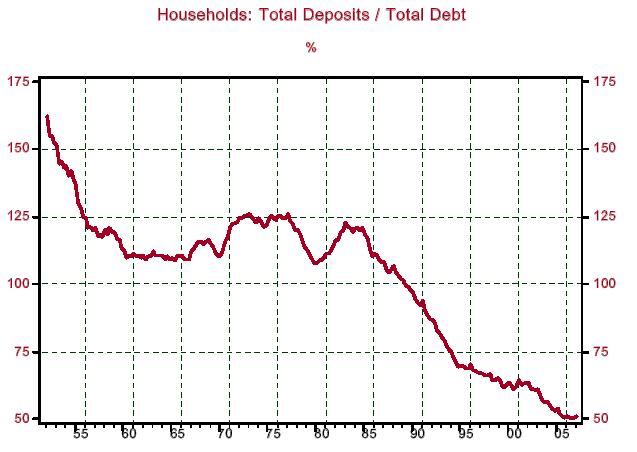
With total household leverage just off a record high, household liquidity, defined as total household deposits as a percent of total household debt, is just off a record low (see Chart 5). I know, I know. Households don't need to be liquid today inasmuch as they can more easily borrow when those rainy days come than they could in yesteryear. My response to that is that households have already used their rainy-day borrowing during the sunny days (again see Chart 3).
Chart 5
By Paul L. Kasriel
The Northern Trust Company
Economic Research Department - Daily Global Commentary
Copyright © 2007 Paul Kasriel
Paul joined the economic research unit of The Northern Trust Company in 1986 as Vice President and Economist, being named Senior Vice President and Director of Economic Research in 2000. His economic and interest rate forecasts are used both internally and by clients. The accuracy of the Economic Research Department's forecasts has consistently been highly-ranked in the Blue Chip survey of about 50 forecasters over the years. To that point, Paul received the prestigious 2006 Lawrence R. Klein Award for having the most accurate economic forecast among the Blue Chip survey participants for the years 2002 through 2005.
The opinions expressed herein are those of the author and do not necessarily represent the views of The Northern Trust Company. The Northern Trust Company does not warrant the accuracy or completeness of information contained herein, such information is subject to change and is not intended to influence your investment decisions.
Paul L Kasriel Archive |
© 2005-2022 http://www.MarketOracle.co.uk - The Market Oracle is a FREE Daily Financial Markets Analysis & Forecasting online publication.