


Stocks Bear Market Rally Coming to an End
Stock-Markets / Stocks Bear Market Aug 02, 2009 - 04:21 PM GMTBy: Andre_Gratian

 Current Position of the Market
SPX: Long-term trend - Down! The very-long-term cycles have taken over and if they make their lows when expected, the bear market which started in October 2007 should continue until 2012-2014. This
SPX: Intermediate trend - The counter-trend rally which started in March is now coming to an end. The objective for a high is being reached and deceleration is becoming apparent. If the top has not already been reached, it should be, shortly!
Analysis of the short-term trend is done on a daily basis with the help of hourly charts. It is an important adjunct to the analysis of daily and weekly charts which determines the course of longer market trends.
Daily market analysis of the short term trend is reserved for subscribers. If you would like to sign up for a FREE 4-week trial period of daily comments, please let me know at ajg@cybertrails.com .
Overview:
Signs that the rally from 667 may be coming to an end are appearing. The newsletter of 7/20 stated the following:
"There are now two potential projections for the high in the SPX: 962 and 1000. We'll have to decide which of the two will work best as we move forward".
Last Thursday, the SPX traded at 996.68 which is very close to the higher projection then backed off, closing on Friday at 987.30.
That alone is not convincing enough that we have seen the high, but next week should give us some additional confirmation since the time projection was given as the end of July into the first part of August. Furthermore, between 7/23 and 7/29, the consolidation made by the index established a Point & Figure count which has the potential of reaching all the way to 1020. 996 was only the half span of the potential count. Whether or not we go higher will depend on how much weakness there is on Monday's opening. If the opening thrust takes prices below 980, it will increase the possibility that Thursday was the high of the move. A move below 976 with hourly A/D's in excess of -1500 would make it even more so.
In spite of its appearance and points gained, there are a number of signs that the move from 667 was not a particularly strong move, especially the "C" wave (?) which is currently ending. The volume has been on the weak side, and the entire pattern is beginning to look like a wedge which is approaching a .382 retracement of the decline from 1576. Everything considered, there are a lot of reasons to believe that we could be nearing an important top. Let's look at individual charts!
What's ahead?
Chart Pattern and Momentum
The weekly chart clearly shows why we have arrived at some important resistance from a number of different sources: there is a former top from 11/4/08, a top channel line (black dashed line), .382 retracement of the decline from the October high, and the top line of the wedge which is being formed from the 667 low. This should be good enough for at least a pull-back! In addition, consider that the top indicator is very overbought and that the lower indicator is beginning to show negative divergence in the histogram. Not to mention the other reasons given in the opening remarks.
On the other hand, if we continue to move up from here, we will have to revise our entire potential scenario for a top.
The daily chart (below) is showing some of the same characteristics as the weekly: Overbought momentum oscillator and divergence beginning to appear in the histogram, but the most weakness is showing in the A/D oscillator which has plenty of divergence to the price and to the momentum oscillator. The SPX is hitting resistance created by the top wedge line (red) and the extension of the former trend line (dashes). It is also trading outside of its narrow up-channel. All that is needed for a confirmed sell is for the price to close below the red horizontal line which is roughly at 967.
If we did get a sell signal, we would initially find support at the level of the 50 and 30 MAs, and the green trend line which is the bottom of the wedge.
The hourly chart (below) shows us the shape of the last rally from 7/10. It has been losing momentum since 7/23 and on Friday came to rest on the bottom line of its up-channel.
Besides breaking out of the channel line, there are two support levels which, if broken, could signal a reversal. The first one at about 982 would give us the first sign. That would not be conclusive, but if we continued and went below the lower one at 965, it would be.
The green asterisk represents the ideal low of a 6-week cycle. Along with overhead resistance, It has already caused the rally to sputter at 996 and could continue to pull prices down for a few more hours on Monday morning. While there is a strong possibility of moving below the first red line, it will be difficult to drop all the way below the second right away. Most likely, we'll find support and attempt to continue the rally after the cycle has made its low. And since we still have potential higher counts, I would not be surprised to see a slightly new high being reached.
The top oscillator best reflects the deceleration which is taking place, but it remains positive. The lower (A/D) showed plenty of strength in the last spike, and does not look that vulnerable.
Finally, the price is still trading above its MAs, and would have to penetrate them before it can give a conclusive sell signal.
One of the things that we look for at a top is the underperformance of the NDX. This may be just beginning. The index ended the day slightly above its 50 MA with the various oscillators all pointing down. The QQQQ only needs to drop 4 cents on Monday morning to be below it, and the Nasdaq A/D is showing a little more weakness than the NYSE's. Since this index has led the SPX during the whole rally, it will be very significant if this relative weakness continues. The daily NDX chart does not have a wedge pattern, but it is overbought and at the top of a channel.
Cycles
"Long-term cycles should provide some buoyancy until the end of July or early August but they could be trumped by weak economic data." This was written in the last newsletter. Instead of weak data, good earnings and other economic reports helped to give us what is probably the final wave of this rally.
The long-term cycles should begin to take over shortly, and according to Ray Merriman, one of these could be the 4-year cycle which is due in 2010. The last 4-yr cycle bottomed in an unconventional manner a little early, in August 2006, so we don't know if its next low will be back to its familiar October pattern or if it will be earlier, but we will have plenty of time to figure it out. In any case, if we are at the top of the 4-year cycle, we are looking for a long decline from here into the late Summer or Fall 2010.
After the 6-wk cycle low which is ideally due on Monday, there will be some smaller cycles bottoming in the middle of August.
The 20-wk cycle was a complete dud and had little effect on the market.
Projections:
The primary projection was to about 1000. This was almost met at 996, last Thursday. Since there is still little weakness in the market, and since the 5-day consolidation that took place between 7/24 and 7/29 created a P&F base which carries higher counts, it is conceivable that we could fetch higher prices next week. I will be better able to estimate the final projection after we have completed the current correction.
Breadth
The McClellan summation index below (courtesy of StockCharts) has recovered almost all the way to its previous high. This is an indication of the strength of the market. However, since it has not yet made a new high and the SPX has, we have negative divergence. The RSI has moved all the way to its overbought area but has not yet turned down.
The daily breadth readings are showing negative divergence relative to price. The hourly A/D is in the process of correcting from an overbought position.
Market Leaders and Sentiment
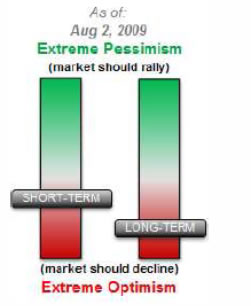
Sentiment readings (courtesy of Sentimentrader) are becoming heavily negative for the long term and slightly negative for the short term.
The NDX/SPX ratio is just beginning to form a top, meaning that the NDX has stopped outperforming the SPX and looks ready to do the opposite. There are several negatives on this chart: the portion from 1500 to 1640 is much smaller than the first up leg from 1323, which has caused severe negative divergence on the MACD. The STO is overbought and needs to correct. It is just starting. The 20EMA is acting as a short term trend line. Once broken, it will mean that the NDX has begun to under-perform the SPX on a daily basis.
Summary
The list of signs that the move from 667 is running out of steam is very long and the projection of about 1000 which had been made for the top of the rally has essentially been reached.
Nevertheless, short-term conditions do not call for an immediate reversal, and the SPX could still make a slightly higher high before beginning a long decline into 2010.
If we do make a top in this area, it is more likely to be a slow roll-over than an immediate plunge.
The following are examples of unsolicited subscriber comments:
Awesome calls on the market lately. Thank you. D M
Your daily updates have taken my trading to the next level. D
… your service has been invaluable! It's like having a good technical analyst helping me in my trading. SH
I appreciate your spot on work more than you know! M
But don't take their word for it! Find out for yourself with a FREE 4-week trial. Send an email to ajg@cybertrails.com .
By Andre Gratian
MarketTurningPoints.com
A market advisory service should be evaluated on the basis of its forecasting accuracy and cost. At $25.00 per month, this service is probably the best all-around value. Two areas of analysis that are unmatched anywhere else -- cycles (from 2.5-wk to 18-years and longer) and accurate, coordinated Point & Figure and Fibonacci projections -- are combined with other methodologies to bring you weekly reports and frequent daily updates.
“By the Law of Periodical Repetition, everything which has happened once must happen again, and again, and again -- and not capriciously, but at regular periods, and each thing in its own period, not another’s, and each obeying its own law … The same Nature which delights in periodical repetition in the sky is the Nature which orders the affairs of the earth. Let us not underrate the value of that hint.” -- Mark Twain
You may also want to visit the Market Turning Points website to familiarize yourself with my philosophy and strategy.www.marketurningpoints.com
Disclaimer - The above comments about the financial markets are based purely on what I consider to be sound technical analysis principles uncompromised by fundamental considerations. They represent my own opinion and are not meant to be construed as trading or investment advice, but are offered as an analytical point of view which might be of interest to those who follow stock market cycles and technical analysis.
Andre Gratian Archive |
© 2005-2022 http://www.MarketOracle.co.uk - The Market Oracle is a FREE Daily Financial Markets Analysis & Forecasting online publication.