


May PPI: Still Scant Evidence of Food/Energy Price Surge Pass-Through
Economics / Inflation Jun 15, 2007 - 01:56 AM GMTBy: Paul_L_Kasriel
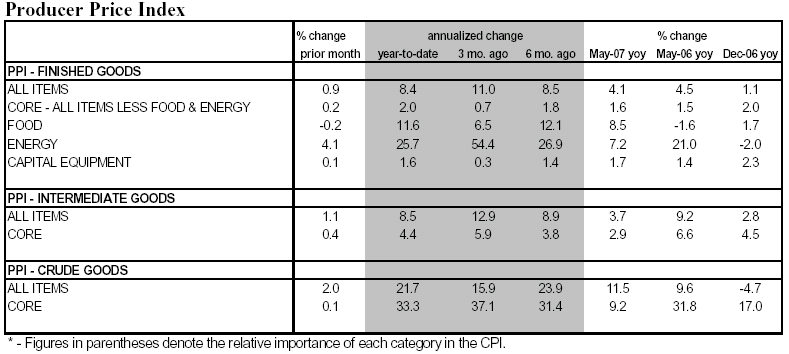
 Just like every headline economic statistic of late, the Finished-Goods All-Items PPI increased a greater-than-expected 0.9% in May after a 0.7% rise in April. As the table below shows, another sharp rise in energy prices dominated the increase in finished-goods prices. After six consecutive monthly increases, finished-food prices declined marginally.
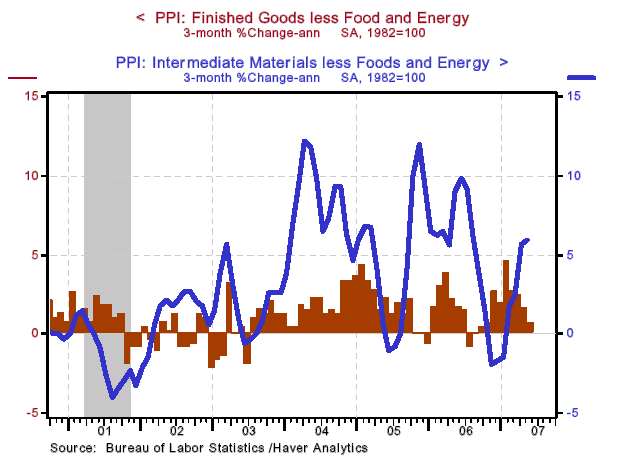
As the Chart 1 below vividly illustrates, producer-price inflation has accelerated at the intermediate-goods and finished-goods levels. But Chart 2 shows that food-and-energy-price induced increases in producer prices are not passing through to a large extent so far to the prices of finished producer goods excluding food and energy. In the three months ended May, the "core" Finished-Goods PPI is up at an annualized rate of only 0.75% -- the lowest since September 2006. But Chart 2 does show that core intermediate-goods producer price increases have re-accelerated.
There appears to be about a four-month lag between core intermediate-goods inflation and core finished-goods inflation. So, the re-acceleration in core intermediate-goods inflation could lead to a re-acceleration in core finished-goods inflation a few months down the road. That said, the correlation between the two when core intermediate-goods inflation is advanced by four months is only 0.27, suggesting a relatively weak relationship. For the record, there seems to be little relationship between core intermediate-goods producer inflation and core consumer -goods inflation, contemporaneously or leading. Moreover, core consumer-goods wholesale inflation does not show any leading characteristics with regard to core consumer-goods retail inflation.
Chart 1
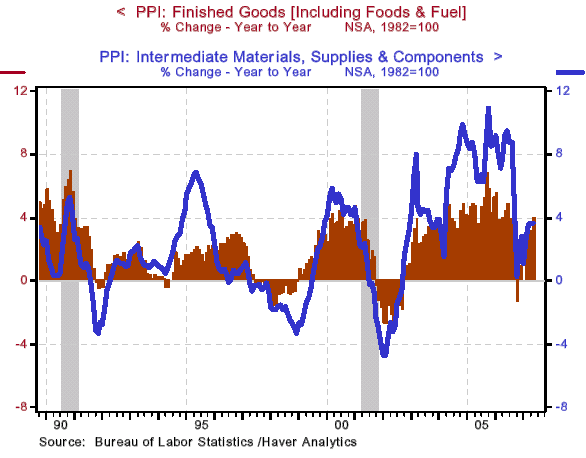
Chart 2
I guess the bottom line of all this is that unless the Fed is more worried about producer inflation than consumer inflation, the May PPI data are not terribly relevant to FOMC policy decisions, with one exception . The medical care component of the PPI increased only 0.1% in May after a 0.2% increase in April. Medical care has a relatively high weight in the Personal Consumption Expenditures (PCE) price index, the presumed Fed-preferred measure of consumer inflation. Therefore, the May core PCE price index would be expected to again show only a relatively small increase as far a medical care costs are concerned.
Upside Surprise on May CPI Could Imply Downside Surprise to Real Retail Sales
If the headline May CPI increase should follow in the footsteps of the May PPI higher-than-expected increase, then there might be a downside surprise to May retail sales. Taking out bar and restaurant sales from total retail sales and deflating that by the PPI for consumer goods, we find that this measure of "real" retail sales increased by only 0.3% in May compared to the 1.5% increase (again, excluding sales of food services) in reported nominal retail sales. On a three-month basis, this measure of real retail sales has contracted 1.1%. See Chart 3 below for the pictorial of all this. But we will have to wait until Friday morning for the CPI report to more accurately gauge the improvement in price-adjusted retail sales.
On the Verge of an Historic First?
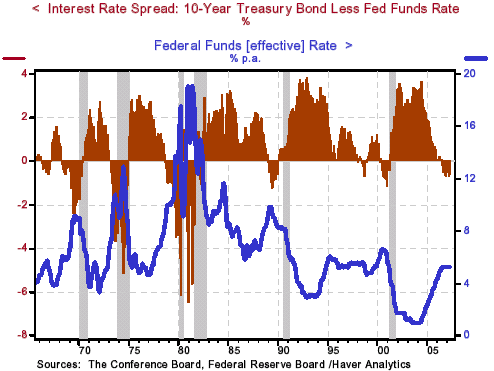
On Tuesday, the yield on the Fed's constant-maturity 10-year Treasury security closed at 5.26%, which also was the level of the effective federal funds rate. The reason I mention this is that we may be only one stronger-than-expected economic release away from the yield on the 10-year Treasury security going above the effective federal funds rate. If this positive spread between the Treasury 10-year and the fed funds rate were to be maintained on a monthly average basis, it would be the first time in the history of this series, which dates back to August 1954, that we have gone from a negative spread back to a positive spread without the federal funds rate falling (see Chart 3). Perhaps we do live in a new era?
Chart 3
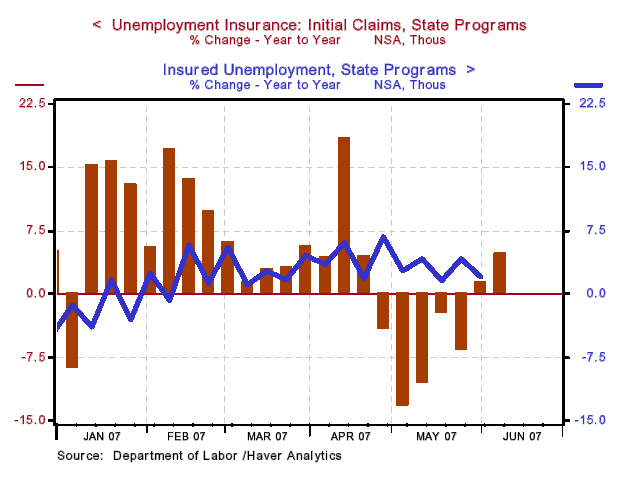
Unemployment Claimants Higher Than Year-Ago
Looking at unemployment claims on an unadjusted basis, new claims have for the past two weeks once again moved above year-ago levels. Continuing claims persistently have been above year-ago levels since mid February. See Chart 4 for the behavior of claims in 2007. The fact that both new and continuing unemployment insurance claims are above year-ago levels is evidence of a weakening demand for labor. These claims data are about as pure as the driven snow - no seasonal adjustments, no sample, but a universe and no business "birth/death" adjustments.
Chart 4
By Paul L. Kasriel
The Northern Trust Company
Economic Research Department - Daily Global Commentary
Copyright © 2007 Paul Kasriel
Paul joined the economic research unit of The Northern Trust Company in 1986 as Vice President and Economist, being named Senior Vice President and Director of Economic Research in 2000. His economic and interest rate forecasts are used both internally and by clients. The accuracy of the Economic Research Department's forecasts has consistently been highly-ranked in the Blue Chip survey of about 50 forecasters over the years. To that point, Paul received the prestigious 2006 Lawrence R. Klein Award for having the most accurate economic forecast among the Blue Chip survey participants for the years 2002 through 2005.
The opinions expressed herein are those of the author and do not necessarily represent the views of The Northern Trust Company. The Northern Trust Company does not warrant the accuracy or completeness of information contained herein, such information is subject to change and is not intended to influence your investment decisions.
Paul L. Kasriel Archive |
© 2005-2022 http://www.MarketOracle.co.uk - The Market Oracle is a FREE Daily Financial Markets Analysis & Forecasting online publication.