


The Stock Market Leadership Ratio Chart, Part1
Stock-Markets / Stock Index Trading Aug 18, 2009 - 02:59 AM GMTBy: Marty_Chenard

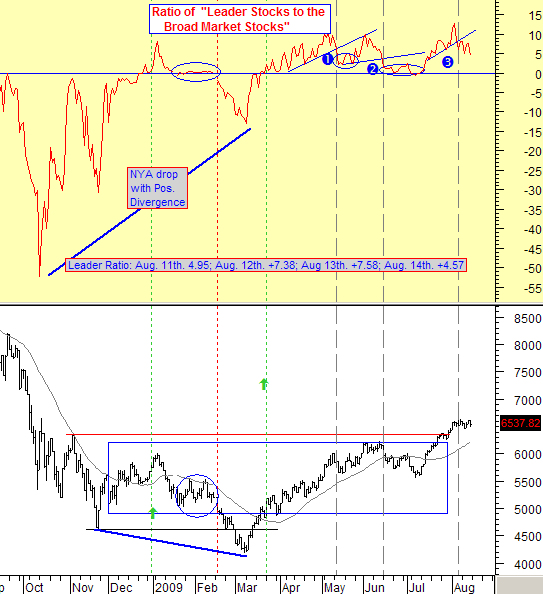
 On our daily Leadership Ratio chart, we measure the strength of the Leadership stocks and compare them to the strength of the Broad Market stocks. We then divide the two numbers and create a Ratio that shows if the Leaders are moving forward or retreating relative to the Broad Market stocks.
So what is the Leadership Ratio saying?
1. That the Leaders are still charging forward as a group. 2. However, a some of the Leaders are retreating.
What does that mean?
It means that the majority of the Leaders are still moving forward. The minority pulling back are inducing a weakness in the overall effort ... so that shows up as market weakness/softness.
Currently, this is a short term problem that will give the market higher than normal intra-day volatility.
Is there anything worth noting about the current pattern of the Leadership stocks?
Yes ... and you can see the pattern when you look at our labels numbered from 1 to 3.
Each number label shows that a Leadership Ratio up trend was broken to the downside (while still in positive territory).
- After the support was broken at label 1, the NYA Index dropped for 3 days.
- The second time it happened (label 2), the NYA Index dropped for 15 days. Note that the Leadership Stock Ratio went all the way down to zero (Neutral) and held that level ... after which it rallied up again.
- So, now we are at label 3 where the support was broken to the downside again. We can say that we have had "market softness" since August 6th. when the support was broken, because the market has not made any upside progress at all.
What will it do this time? Will we retreat further, hold better than before, or move up higher this time?
Is there another market factor that determines what happens to the Leadership Ratio?
There is, and we will show you that piece of the equation in Part II of this discussion tomorrow.
*** Feel free to share this page with others by using the "Send this Page to a Friend" link below. One quick personal note ... We depend on "word of mouth" actions by visitors like yourself, telling others about our free daily update service. If you have enjoyed your daily updates and have found them beneficial, then please think about returning the favor and telling others about stocktiming.com. We do no paid advertising, so we count on each of you to help spread the word. Many Thanks, Marty Chenard
By Marty Chenard
http://www.stocktiming.com/
Please Note: We do not issue Buy or Sell timing recommendations on these Free daily update pages . I hope you understand, that in fairness, our Buy/Sell recommendations and advanced market Models are only available to our paid subscribers on a password required basis. Membership information
Marty Chenard is the Author and Teacher of two Seminar Courses on "Advanced Technical Analysis Investing", Mr. Chenard has been investing for over 30 years. In 2001 when the NASDAQ dropped 24.5%, his personal investment performance for the year was a gain of 57.428%. He is an Advanced Stock Market Technical Analyst that has developed his own proprietary analytical tools. As a result, he was out of the market two weeks before the 1987 Crash in the most recent Bear Market he faxed his Members in March 2000 telling them all to SELL. He is an advanced technical analyst and not an investment advisor, nor a securities broker.
Marty Chenard Archive |
© 2005-2022 http://www.MarketOracle.co.uk - The Market Oracle is a FREE Daily Financial Markets Analysis & Forecasting online publication.