


May CPI: Still Scant Evidence of Food/Energy Price Surge Pass-Through
Economics / Inflation Jun 16, 2007 - 01:47 AM GMTBy: Paul_L_Kasriel
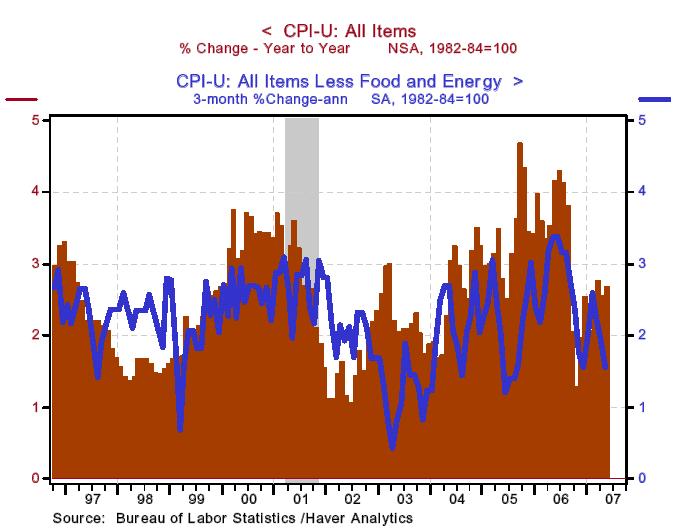
 If this headline looks familiar, it is because yesterday's commentary had almost the same headline, save for "PPI" instead of "CPI." (Speaking of yesterday's commentary, I inadvertently omitted a chart, which no one called to my attention. Hmm, perhaps no one other than me read it!) As the table below indicates, headline CPI inflation has accelerated, primarily because of spiking energy prices. But excluding energy and food prices, the so-called core rate of CPI inflation is moderating (see Chart 1). On a year-over-year basis, the previous peak in all-items CPI inflation occurred way back in September 2005 at 4.7% -- a full 200 basis point over its current rate.
I think it is excessive smoothing to look at the core CPI on a year-over-year basis inasmuch as one of the principal rationales for a core concept is to eliminate short-term noise in price indexes due to the assumed volatility in food and energy prices. This is why I have chosen to chart the core CPI inflation on a 3-month annualized basis. On this basis, core CPI inflation, after peaking at an annualized rate of 3.4% in May 2006, has slowed to just 1.6% in the three months ended May 2007. For those who do look at year-over-year changes in core consumer prices, presumably the FOMC, the year-over-year change in the core CPI in May was 2.24%. Given the recent 30 to 35 basis point spread of core CPI inflation over core Personal Consumption Expenditure (PCE) inflation, the May CPI data suggest that the year-over-year change in the core PCE price index, which was 2.0% in April, could dip below the magic 2% boundary for May. That is, there is a decent chance that core PCE inflation on a year-over-year basis slows to within the FOMC's "comfort zone."
Consumer Price Index - May 2007
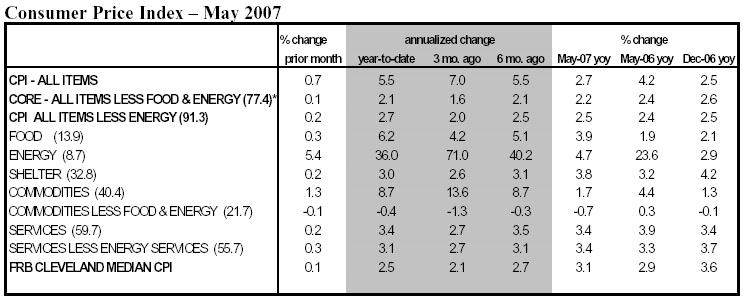
Chart 1
Does this suggest that the FOMC is ready to cut the federal funds rate?
No. Why not? Because the FOMC would be quite pleased to see core consumer inflation moderate further so long as real economic activity is rebounding . And real economic activity has rebounded in this current quarter, although perhaps not as much as the consensus believes. I believe that the second-quarter rebound in real GDP growth is a false dawn. I am forecasting a renewed weakening in real growth in the third quarter along with continued moderation in core inflation. As a result, I am probably the only one left with a forecast of some FOMC interest rate cuts starting in the fourth quarter of this year.
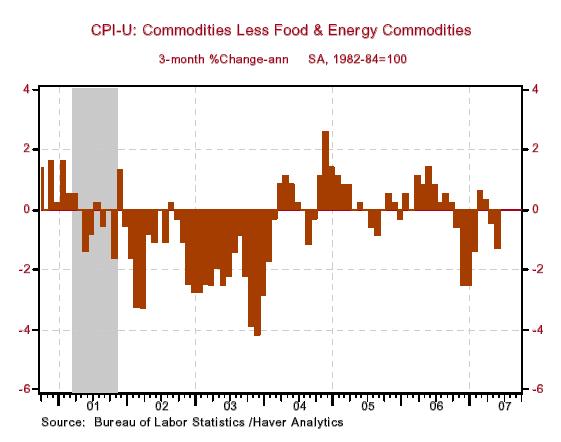
One would think that with the surge in energy and other industrial commodity prices of late, that there would be some significant pass-through into the prices of core consumer goods. But this presumption is incorrect. As Chart 2 shows, since the second half of 2006, there have predominantly been declines in the prices of core consumer commodities (goods).
Chart 2
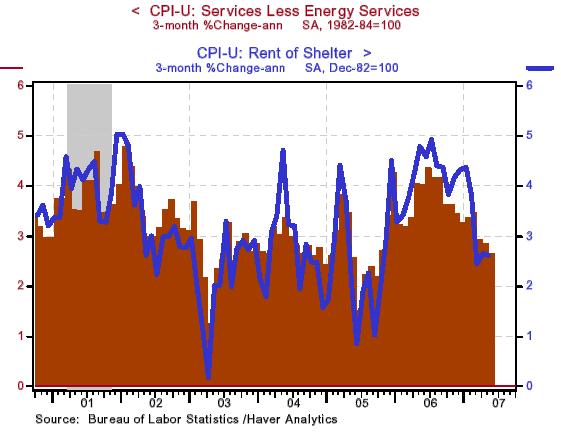
What seems to have slowed the rate of increase in the prices of core consumer services has been the slowdown in increases in the price of shelter - primarily explicit and implicit rents on dwellings. This is shown in Chart 3. This is really no surprise given that there are a record 2.2 million empty houses and condominiums now owned by "accidental" landlords. These landlords are desperate for tenants to help them out with their unanticipated mortgage, tax, insurance and home-owners' association payments.
Chart 3
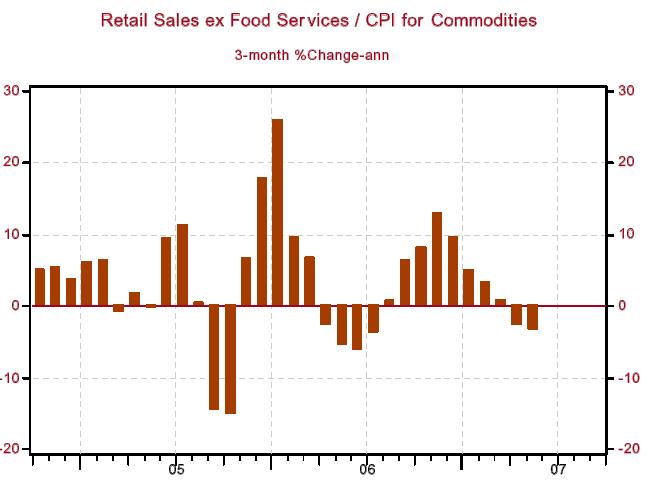
May Retail Sales - Objects Appear Much Larger Than They Are Before Price Adjustment
In nominal terms, retail sales excluding food services increased 1.5% in May after falling 0.1% in June. But, when these sales are adjusted by the CPI for commodities (goods), May was up only 0.2% and April was down 0.7%. In the three months ended May, price-adjusted retail sales contracted at an annual rate of 3.4% (see Chart 4). The April-May average of price-adjusted retail sales excluding food services is contracting at an annual rate of 2.9% vs. the first-quarter average. In the first quarter, these price-adjusted sales grew at an annualized rate of 3.0%.
Total real PCE got a boost in April from home utilities expenditures for heating because of the unseasonably cold weather. Although May real PCE will get a boost from goods purchases, home utilities expenditures will likely be down sharply. The upshot of all this is that real consumer spending is on a course to slow significantly in the second quarter. With employment growth slowing and house prices falling, I see this slowdown in real consumer spending as the beginning of a new trend rather than a one-quarter aberration.
Chart 4
Perhaps Industrial Sector Rebound Not As Strong As Perceived
That's the message from the May Industrial Production report issued by the Fed. Total industrial production was flat in May after a 0.4% increase in April (originally reported as a 0.7% increase). Just as April IP got a boost from utilities output due to the colder-than-seasonal weather, May was held back by this factor. Also, the increase in manufacturing output for April was scaled back to 0.2% from its preliminary estimate of 0.5%. Manufacturing output in May is estimated to have increased by 0.1%. Motor vehicle production was a drag on manufacturing output in May. Not surprising in that sales of light motor vehicles stalled out starting in January, in part because of the spillover from the housing recession.
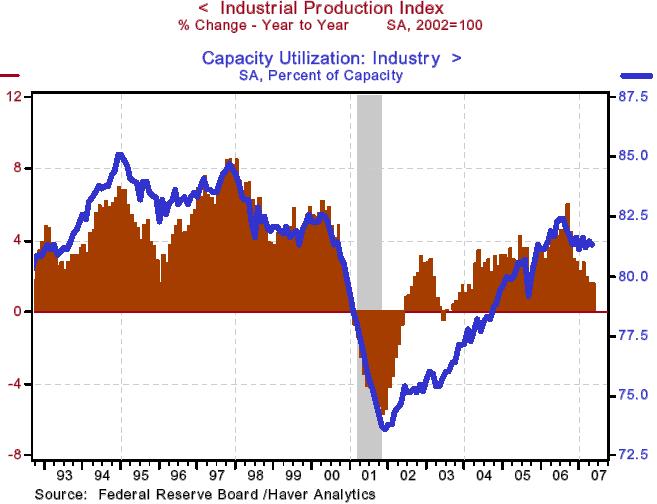
Chart 5 shows that year-over-year growth in total industrial production has been on a downward trend after its Katrina-echo peak of about 6% in September 2006. As of this May, its growth was only about 1.6%. Notice that growth in industrial production this cycle never got as high as it did in last cycle. The other series plotted in Chart 5 is capacity utilization. It, too, never got as high as it did in the last cycle. The current relatively low level of capacity utilization, 81.3% vs. a 35-year average of 81.0, is another reason why I question any significant pick-up in the growth of business capital spending. Why add to capacity when you are not bursting at the productive seams currently and domestic demand is softening?
Chart 5
Higher Gasoline Prices Deflate Consumer Sentiment
The preliminary read on the University of Michigan consumer expectations component of consumer sentiment fell 4.6 points to 73.0 in June. This coincided with an increase in one-year ahead inflation expectations from survey respondents to 3.5% vs. 3.3% in the May survey. Undoubtedly, rising gasoline prices played a large role in curbing expectations of better economic times ahead and raising inflation expectations. Truth be told, these consumer surveys tend to contain very little information about what household spending will do going forward. But just for the record, I will point out that the preliminary June level of consumer expectations is below the trough level of this measure in the last recession (see Chart 6).
Chart 6
By Paul L. Kasriel
The Northern Trust Company
Economic Research Department - Daily Global Commentary
Copyright © 2007 Paul Kasriel
Paul joined the economic research unit of The Northern Trust Company in 1986 as Vice President and Economist, being named Senior Vice President and Director of Economic Research in 2000. His economic and interest rate forecasts are used both internally and by clients. The accuracy of the Economic Research Department's forecasts has consistently been highly-ranked in the Blue Chip survey of about 50 forecasters over the years. To that point, Paul received the prestigious 2006 Lawrence R. Klein Award for having the most accurate economic forecast among the Blue Chip survey participants for the years 2002 through 2005.
The opinions expressed herein are those of the author and do not necessarily represent the views of The Northern Trust Company. The Northern Trust Company does not warrant the accuracy or completeness of information contained herein, such information is subject to change and is not intended to influence your investment decisions.
Paul L. Kasriel Archive |
© 2005-2022 http://www.MarketOracle.co.uk - The Market Oracle is a FREE Daily Financial Markets Analysis & Forecasting online publication.