


Stock Market Investors Should You be Bold or Cautious Now?
Stock-Markets / Stock Market Sentiment Aug 28, 2009 - 06:36 PM GMTBy: Marty_Chenard

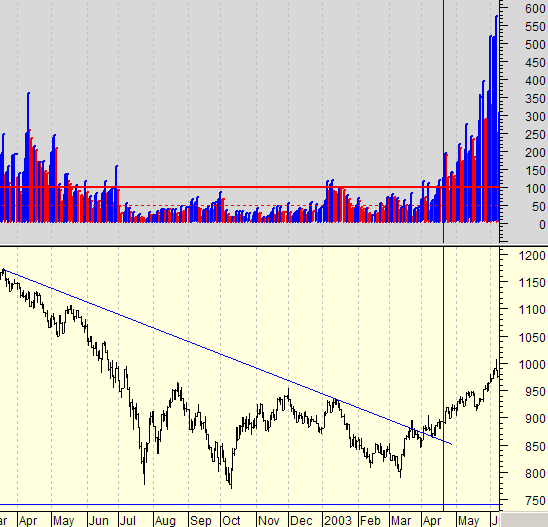
 ... It was April 2003 and investors were tired of the old Bear market and wondering when it would end.
The number of New Daily Highs on the New York Stock Exchange spend almost a full year under the 100 per day level ... in fact, it spend about 6 months with the number of New Daily Highs below 50 per day.
And then it happened ... The Number of New Daily Highs went from below 50, to above 50, and then to above 100. From 100 it just kept climbing to 200, to 300, to 400 and higher. After the 100+ level, the new Bull Market was launched as seen in today's first chart below.
This is one of the charts that we post every day on our paid subscriber site. For this chart, we say that: A minimum of 100 is a very important level in a rally. 150 is what we want to see ... and we want to see the trend going up, not down.
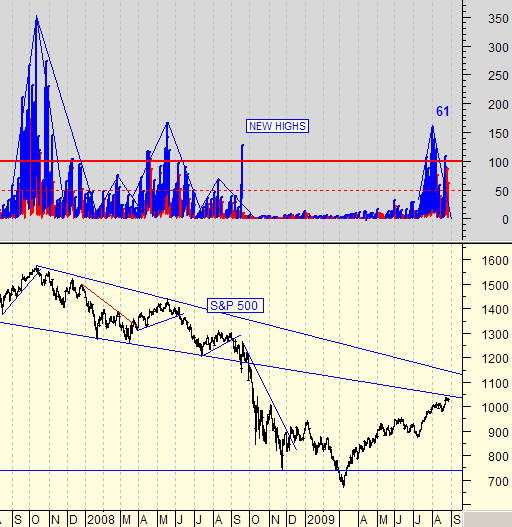
What does the current chart look like? See the next chart for the answer ...
From last October to this past June, the New York Stock Exchange New Highs have been doggedly stuck below 50.
And then ... we moved up above 50 in July, and then above 100, and then above 150. But then we stopped, and started trending down ... below 100. Yesterday, we were at 61, still above 50 but below 100. The New Highs picture doesn't scream "Bull Market" like many are articulating. There is more work to do before we hit the desired levels.
For now, we are still moving down from the 159 peak level we reached on August 3rd. and that creates a "caution condition". We need to reverse the current down trend ... and, we need to see the New Highs move back up above the 100 level.
By Marty Chenard
http://www.stocktiming.com/
Please Note: We do not issue Buy or Sell timing recommendations on these Free daily update pages . I hope you understand, that in fairness, our Buy/Sell recommendations and advanced market Models are only available to our paid subscribers on a password required basis. Membership information
Marty Chenard is the Author and Teacher of two Seminar Courses on "Advanced Technical Analysis Investing", Mr. Chenard has been investing for over 30 years. In 2001 when the NASDAQ dropped 24.5%, his personal investment performance for the year was a gain of 57.428%. He is an Advanced Stock Market Technical Analyst that has developed his own proprietary analytical tools. As a result, he was out of the market two weeks before the 1987 Crash in the most recent Bear Market he faxed his Members in March 2000 telling them all to SELL. He is an advanced technical analyst and not an investment advisor, nor a securities broker.
Marty Chenard Archive |
© 2005-2022 http://www.MarketOracle.co.uk - The Market Oracle is a FREE Daily Financial Markets Analysis & Forecasting online publication.