


Three More Banks Go Bust, Tax Payers Stuck With More Toxic Assets
Stock-Markets / Financial Markets 2009 Sep 13, 2009 - 06:30 AM GMT

 These are taken from the FDIC Failed Bank List. No further comment is necessary.
Taxpayers are stuck with another $4 billion of toxic waste.
The last domino of the big three has fallen: Corus Bank has been seized by the OCC. The bank, with $7 billion in assets and deposits, will transfer $3 billion of its assets to MB Financial Bank and all of its deposits. How nice of the FDIC to stick taxpayers with $4 billion in "assets" and no deposits against them. "The FDIC will retain the remaining assets for later disposition. The FDIC plans to sell substantially all of the remaining assets of Corus Bank in the next 30 days in a private placement transaction." The cost to the FDIC, pulled straight out of the rose-colored kaleidoscope, will be $1.7 billion.
San Fran Fed's Janet Yellen Shares Some Misinformation On The Fed's "Credbility"
"The Fed's analytical prowess is top notch, and our forecasting record is second to none. The FOMC is committed to price stability and has a solid track record in achieving it." You have to watch the video.
The VIX does a trendline bounce.
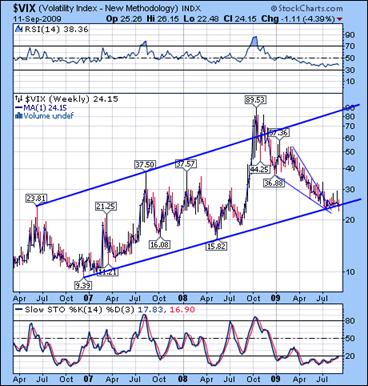 --The VIX made a new low, then bounced back to Critical Support/Resistance at 24.61. There may be a trendline break, but that could be classified as a “false break” if we see a recovery above the trendline next week. The reason I suggest this is that 4th waves under Elliott Wave rules and guidelines may fall below the channel trendline. In that case, it is often an indication that the final wave may “throw over” the top trendline in the final thrust. God help us if we are in a wave B, since the throw-over could be enormous.
The SPX in time and space.
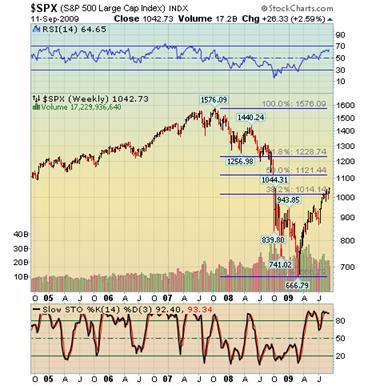
--The SPX has stalled for over a month at the 38.2% retracement level (1014). What has it been waiting for? Maybe it is time. The 38.2% retracement of the decline from Oct 2007 to March 2009 in time happens to occur on September 14th. Frankly, I have no clue how this interacts with options expiration week. Will the decline start on Monday…or will the markets hold up until Friday?
Critical Support is at 1030. Despite the run-up at the end of the day, SPY trading volume was low and negative.
The NDX is also at a critical juncture.
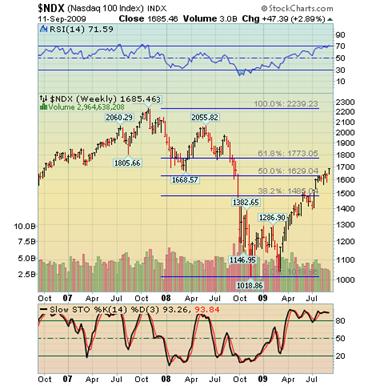
--The NDX time retracement is different, since the low was on November 21, 2008 and not in March. However, it, too, is approaching/has passed another Fib retracement in Time. September 8th is the 75% retracement, while late this week is the 78.6% retracement. Critical Support/Resistance is at 1662.
GLD broke out of its symmetrical triangle.
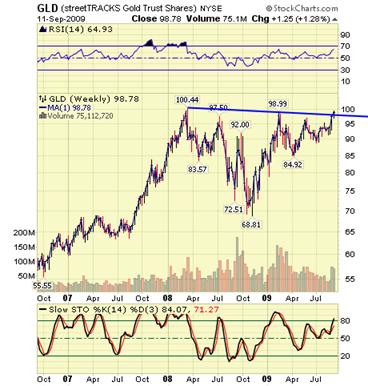
-- GLD closed above its head and shoulders neckline on Friday. Despite the naysayers, this commodity has room to move much higher in a classic “melt-up” scenario. Something is spooking certain groups of investors, but I focus primarily on the Chinese. The Central Bank is still buying gold. Critical Support on Friday stood at 97.88 and I remain bullish above that.
USO repelled by the trendline.
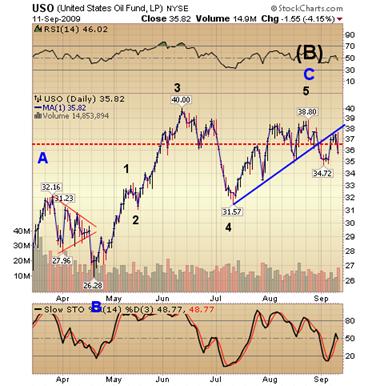
--USO was repelled by the trendline after a three-day re-test. It fell dramatically below Critical Resistance at 36.60 on Friday and now appears ready for an extended decline to 30. Note there may be a potential head and shoulders neckline at 34.72 with the same target.
XLF may be on the verge of a collapse.
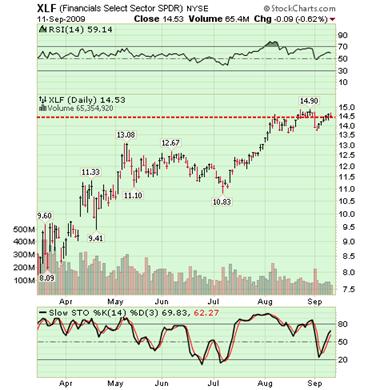
The August 27th top in XLF held and it now presents us with a reversal pattern and a very tight trigger from Critical Support/Resistance at 14.40. There is now a triple divergence in the RSI and the Slow Stochastics that support the thesis that the final top is in. I replaced IYF with XLF due to the fact that XLF offers a higher degree of liquidity and trading volume.
FXI also presents a potential “hair trigger” signal.
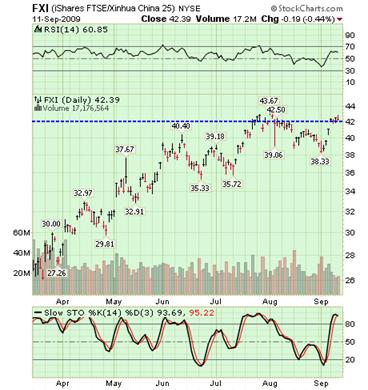 It appears that FXI has finished its retracement and is prepared to decline. A gap down on Monday would be no surprise, since FXI is nicely lined up for a fall. Critical Support/Resistance is at 42.07
TLT tests its neckline support…again.
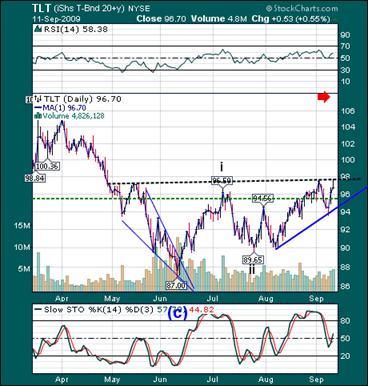
-- TLT retested its neckline Friday and remained above Critical Support is at 95.43. Last week’s decline was a bit deeper than expected, but it did finally bounce at model trend support at 93.50. Once above the neckline, there is a high probability of reaching its target near 108.00.
UUP also reaches its retracement.
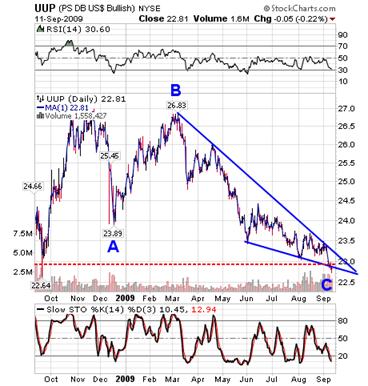 --UUP reached its 78.6% retracement at 22.73 on Friday. Although the lower probe was unexpected a week ago, it now appears that is was needed to complete the wedge formation.
The following comments are from last week and still apply. In summary, wedges triangles and broadening tops are all coiling actions that are building up to strengthen the next move. It is obvious that their reversals may be delayed, but that just tightens the spring for a greater push back when it breaks out. I hope you all have a relaxing weekend!
Regards,
Tony
Our Investment Advisor Registration is on the Web
We are in the process of updating our website at www.thepracticalinvestor.com to have more information on our services. Log on and click on Advisor Registration to get more details.
If you are a client or wish to become one, please make an appointment to discuss our investment strategies by calling Connie or Tony at (517) 699-1554, ext 10 or 11. Or e-mail us at tpi@thepracticalinvestor.com .
Anthony M. Cherniawski,
President and CIO
http://www.thepracticalinvestor.com
As a State Registered Investment Advisor, The Practical Investor (TPI) manages private client investment portfolios using a proprietary investment strategy created by Chief Investment Officer Tony Cherniawski. Throughout 2000-01, when many investors felt the pain of double digit market losses, TPI successfully navigated the choppy investment waters, creating a profit for our private investment clients. With a focus on preserving assets and capitalizing on opportunities, TPI clients benefited greatly from the TPI strategies, allowing them to stay on track with their life goals
Disclaimer: The content in this article is written for educational and informational purposes only. There is no offer or recommendation to buy or sell any security and no information contained here should be interpreted or construed as investment advice. Do you own due diligence as the information in this article is the opinion of Anthony M. Cherniawski and subject to change without notice.
Anthony M. Cherniawski Archive |
© 2005-2022 http://www.MarketOracle.co.uk - The Market Oracle is a FREE Daily Financial Markets Analysis & Forecasting online publication.