


Gold Above $1,000, Is this Time Different?
Commodities / Gold & Silver 2009 Sep 20, 2009 - 12:54 PM GMTBy: Merv_Burak

 Many speculators are getting all excited. Gold, above $1000, gee – that must mean the sky is now the limit. If only it was that easy. Above $1000, we’ve been there before. We’re there again. Who knows, maybe THIS TIME things will be different.
GOLD - LONG TERM
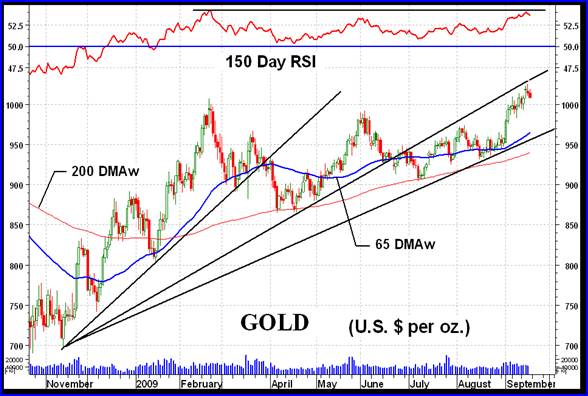
If we only go back to the start of the latest bull move it does look like we have broken above previous highs into new territory. Of course we all know that the all time high (at least by modern standards) was made in mid-March of 2008 at the $1034 level, so we’re not quite there yet.
I show here the long term momentum indicator that I use for my long term ratings. It is a 150 day RSI (or using a weekly chart, a 30 Week RSI). As a long term move the momentum indicator is not encouraging just yet. The latest price move into new recent highs is not confirmed by the momentum indicator. It could not quite make it to its previous level of 54.14%. It only made it to 54.05%. Of greater concern is that these two momentum values (Feb and Sept) are significantly lower than the value at the all time high, which was 61.0%. Although the price is getting very close to its all time high value the momentum indicator is far, far below its previous high value. The recent bullish moves have been made on much reduced strength and one must worry about the longevity of such move.
Also shown on the chart is one of my FAN PRICIPLE trend lines. This FAN I call a BEARISH DECELERATING FAN. It is a bearish FAN because the result is a reversal into a bear market. It is a decelerating FAN in that, looking at it from the FAN apex point the trend is getting weaker and weaker with each succeeding FAN trend line drawn at a lower and lower slope. With this FAN the breaking of the first trend line is of no concern. The breaking of the second trend line is considered a reversal signal. The breaking of the third trend line is a confirmation of the new trend. We have not yet broken the third FAN trend line for a reversal confirmation. By my FAN PRINCIPLE should the price break back above the second trend line then that would negate the previous bear signal. Otherwise, we are waiting for a bear trend confirmation. Just another of many indicators technicians watch to try to assess what’s happening.
Before getting back to the real world, just a quick note on that very long term P&F chart shown last week. We have added another X to the existing up trend so that we are now up to the all time high, very long term P&F wise. As mentioned last week, we would need a move to the $1050 level to break above these highs, at which time we would get a projection all the way to the $2050 level with an intermediate stop at $1575.
The long term assessment is easy. The price remains well above its positive sloping long term moving average line. The long term momentum indicator remains in its positive zone above its positive sloping trigger line (not shown). The volume indicator continues to move ever higher into new all time high territory. This volume indicator may be telling us that the momentum indicator is giving us a wrong story, let’s hope. As it is, the long term rating remains BULLISH at the present time.
INTERMEDIATE TERM
The story is mostly the same for the intermediate term as for the long term. The price remains well above its positive sloping moving average line. The momentum indicator has not reached its previous high from the Feb top, similar to the long term. The momentum indicator is, however, inside its positive zone. Unfortunately, it has now moved lower and crossed below its trigger line but the trigger remains in a positive slope. The volume indicator is above its positive sloping trigger line for a positive volume message. All in all, the intermediate term rating remains BULLISH, for now.
SHORT TERM
The short term prognosis is a little bit iffy. Although we have had a few good weeks of upside action we have also been seeing a weakening in the movement. The past two days of downside may be just the start of something more. I’m not ready yet to throw in the towel but the market technicals suggest that one would be pretty foolish not to be on guard for some extended downside action.
The price remains above its short term moving average line and the line itself is still pointing upward. The short term momentum indicator, although still very much in its positive zone, has now dropped below its overbought line and below its negatively sloping trigger line. It has also moved below a support that it had established over the past few weeks. The daily volume action had improved somewhat but still could be better. The short term rating remains BULLISH. The very short term moving average line remains above the short term line for confirmation of this rating.
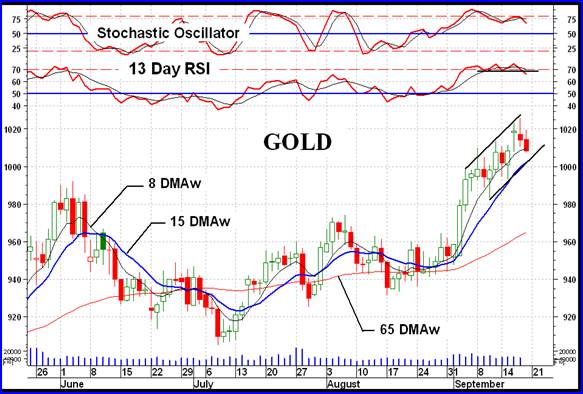
With the short term momentum breaking below its support level, the Stochastic Oscillator showing weakness and the price moving below the very short term moving average line the immediate direction of least resistance should be considered towards the down side. How long this will last is anyone’s guess but a move back towards the 925 level should not be a surprise.
SILVER
The P&F chart seems to be doing us very good service with silver, so here it is again. As always, red is resistance, blue is support and the more pronounced the line the more serious it is. Many projections may be gleamed from this chart but I have just shown the more important ones. The first projection, to $17.50, was at the initial break-out. It has now been met. The next projection, $18.50, is the next step break (light solid red resistance). The other two projections, to $24.50 (note the chart shows $24.00 in error) and then to $32.50, are shown at the two red dashed break-outs. Silver is entering an area of strong resistance from previous times and is also just about at the upper resistance trend line. One might therefore expect a halt very soon to the up trend while silver then takes a rest or even comes down a bit. As with gold, silver may be into a topping out over the past couple of days but any reversal of trend has not yet been confirmed.
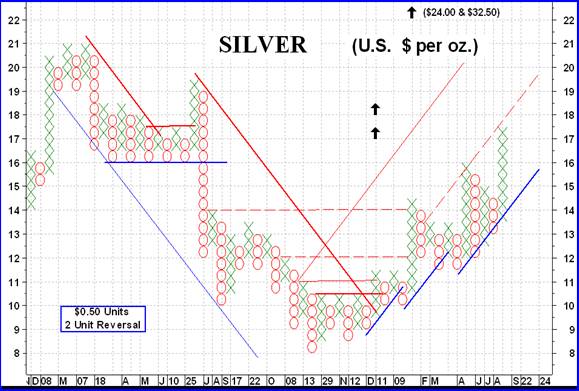
Unlike gold, the silver momentum indicator has moved well above its Feb and June highs and is at its highest level since the very top in March of 2008, when silver was at $21. So, the momentum is confirming the price move and the move by the silver volume indicator into new highs.
Silver stocks (along with the Penny Arcade) were among the few bright spots this past week. Almost everything else in North America was on the down side.
PRECIOUS METAL STOCKS
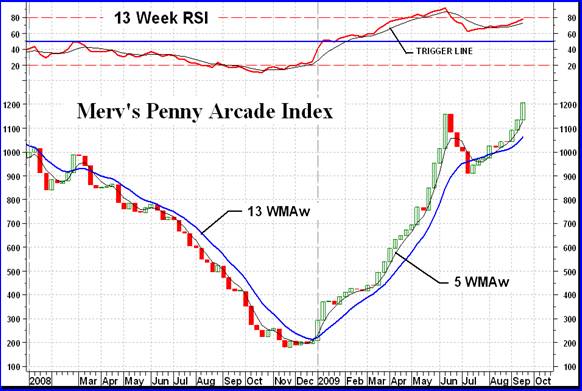
I shouldn’t keep harping about the Merv’s Penny Arcade Index but it was once more well on the up side with an advance of 6.4% while most other North American Indices were in the dumper. As mentioned in the past, as long as the cats and dogs of the industry are still in favor then the bear market is most likely nowhere in sight. Bear markets will in all likelihood start with these penny stocks, not the quality ones.
As far as the North American gold and silver stocks were concerned, if it weren’t for the silver and very speculative stocks everything would have been down. Speculators are still bullish on the precious metals otherwise the very speculative stocks would not be moving on the up side.
Although the overall average price of a stock in the universe of 160 stocks (Merv’s Gold & Silver 160 Index) was up by a fraction there were more losers on the week than winners. 53% of the stocks closed on the down side while 43% closed on the up side. After the past couple of weeks I guess the stocks needed a rest.
MERV’S PRECIOUS METALS INDICES TABLE
Well, that’s it for another week.
By Merv Burak, CMT
Hudson Aero/Systems Inc.
Technical Information Group
for Merv's Precious Metals Central
For DAILY Uranium stock commentary and WEEKLY Uranium market update check out my new Technically Uranium with Merv blog at http://techuranium.blogspot.com .
During the day Merv practices his engineering profession as a Consulting Aerospace Engineer. Once the sun goes down and night descends upon the earth Merv dons his other hat as a Chartered Market Technician ( CMT ) and tries to decipher what's going on in the securities markets. As an underground surveyor in the gold mines of Canada 's Northwest Territories in his youth, Merv has a soft spot for the gold industry and has developed several Gold Indices reflecting different aspects of the industry. As a basically lazy individual Merv's driving focus is to KEEP IT SIMPLE .
To find out more about Merv's various Gold Indices and component stocks, please visit http://preciousmetalscentral.com . There you will find samples of the Indices and their component stocks plus other publications of interest to gold investors.
Before you invest, Always check your market timing with a Qualified Professional Market Technician
Merv Burak Archive |
© 2005-2022 http://www.MarketOracle.co.uk - The Market Oracle is a FREE Daily Financial Markets Analysis & Forecasting online publication.