


Natural Gas UNG ETF Positive Price-Momentum Divergences, Seasonal Probabilities and a Potential ParaSar Buy Setup
Commodities / Natural Gas Oct 01, 2009 - 05:41 PM GMTBy: Mark_Brown

 Anyone who’s been following and/or trading the Natural Gas market for the past two years is well aware of the frightening moves that this volatile energy commodity is capable of, both up and down. And did it ever fall down, with UNG shedding a mind-shattering 86% of its peak value between July 2008 and early September 2009. Right now, however, UNG does appear to be making a strong recovery attempt, and several pieces of technical and fundamental data may prove useful to those seeking to determine the most probable direction for UNG to move in the next few months.
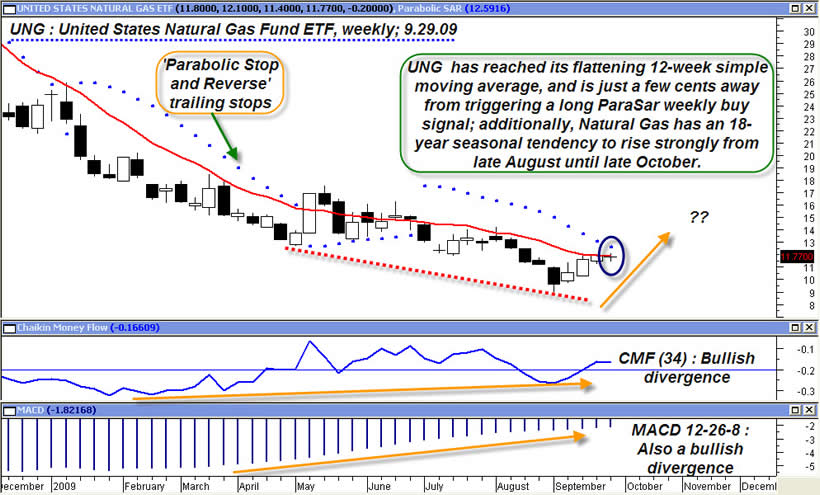
Graphic credit: Metastock
One of the more important items on the chart is the simple moving average (SMA)(red) line; set at 12 periods. The 12-period SMA is an incredibly effective trend-determination tool, when used with other technical confirmation tools, as described in this article.. You can overlay it on almost any daily, weekly or monthly chart and discern the dominant trend direction (or lack of one) of a stock, commodity, ETF or mutual fund in just a few moments. On this weekly chart, we see that UNG is continuing to buck up against the 12-period SMA, and that the moving average also happens to be flattening out – which may be another lagging confirmation that the bear trend in UNG has finally played itself out. UNG is also manifesting significantly bullish price-momentum and money flow-momentum divergences, as evidenced by the series of higher lows in the Chaikin money flow (CMF)(34) indicator and the MACD histogram (set at 12-26-8).
UNG is also very close to triggering a ‘Parabolic Stop and Reverse’ buy signal on this weekly chart; you’ll note the ascending/descending sequence of blue dots on the chart, which act as both buy and sell entry triggers (on a weekly close beyond) and as an initial and trailing stop mechanism. This system, also known as the ParaSar system, was initially made known to the general public in 1978 when J. Welles Wilder released his classic ‘New Concepts in Technical Trading Systems’ in June 1978. The big idea with this system is that it will always get you in on every major move, as long as you take every valid entry/exit signal.
As a trend following system, it generally misses out on the initial phase of strong moves up and down, and in that sense, behaves very much like a channel breakout or volatility breakout system. It also features a certain amount of peak-profit ‘give-back,’ which is also another common feature of trend following systems. For our purposes, what we simply want to do is to see if UNG actually does generate a weekly ParaSar buy signal, as that would be yet another confirmation that Natural Gas is likely to keep grinding higher in accordance with its very reliable 18-year seasonal pattern, one that typically sees Nat Gas rise very strongly from early August until late October.
All told, the confluence of the positive divergences and favorable seasonals would seem to imply that Nat Gas is, at the very least, in the process of forming a major bottom. But if we see a weekly cross and then close above the 12-week SMA, followed by a ParaSar long entry signal, Nat Gas bulls should be provided with an extra dose of confidence to take their desired long entries in accordance with their own well-tested systems and methodologies. By the way, the ParaSar indicator comes standard with Metastock, and is also offered by numerous other charting and technical indicator packages. The ParaSar dots on the above chart use the standard settings, as delivered with Metastock: ‘Step’: .02 and ‘Maximum’ of .20.
By Mark Brown
To receive more information on trading ETF funds visit my website: www.ETFTradingPartner.com
Mark Brown is an independent trader who focuses on trading ETF funds. He has been involved in markets and money management since 1998. His unique trading model which uses a combination of analysis like: economy, market cycles, chart patterns, volume, market internals, and money management. Visit his site: ETF Trading Partner www.ETFTradingPartner.com
© 2009 Copyright Mark Brown - All Rights Reserved Disclaimer: The above is a matter of opinion provided for general information purposes only and is not intended as investment advice. Information and analysis above are derived from sources and utilising methods believed to be reliable, but we cannot accept responsibility for any losses you may incur as a result of this analysis. Individuals should consult with their personal financial advisors.
© 2005-2022 http://www.MarketOracle.co.uk - The Market Oracle is a FREE Daily Financial Markets Analysis & Forecasting online publication.