


U.S. and China Stock ETFs Volume and Money Flow Analysis
Stock-Markets / Investing 2009 Oct 17, 2009 - 01:38 PM GMTBy: Richard_Shaw

 In our last article, we estimated the probable price range of the S&P 500 based on historical and implied volatility, and suggested that the positive area of the range was more likely than the negative area for the next few weeks, because of the moving average trend indicators and the declining volatility of the 1-month and 3-month CBOE volatility indexes.
We also expressed our concern that we could not assess the myriad economic data and opinions to draw a convincing fundamental argument to support those technical conclusions. The fundamentals are mixed and the global condition may be delicate, with potentially major geopolitical risk in the background (Pakistan/Taliban and Iran/Israel in particular). The rewriting of the rules of capitalism in the U.S and the still looming foreclosure situation are not encouraging.
Overall, we see very roughly 9% change potential in the S&P 500 by 12/31/2009, unless there is some major economic shock or geopolitical event. [read article]
Reader Request:
One reader of our article asked whether volume was supportive of the forecast, and if we would publish some related volume studies. That’s what this article is about.
We think it may be interesting to present data for both the U.S. and Chinese stock markets, since they seem to be somewhat opposite poles around which much current global economic reporting revolves.
Volume’s Role In Analysis:
Share volume is a collateral indicator for market performance. Generally, rising volume indicates a strengthening price move, and declining volume indicates a weakening price move. Divergence between price and volume indicators is typically seen as a sign that a change in direction is possible. The assumption is that volume is a leading indicator of trend changes.
Volume:
Volumes for the S&P 500 (proxy SPY) and the China Xinhua 25 (proxy FXI) since the March 9 beginning of the bull run in the U.S. are slightly down. In the case of both country funds there is a divergence; the prices are up and the volumes are down.
That information may be cause for caution regarding increased cash commitments, but it alone is not a cause to sell existing positions. We do recommend, and have been recommending all along, that you use persistent trailing stop loss orders to protect positions.
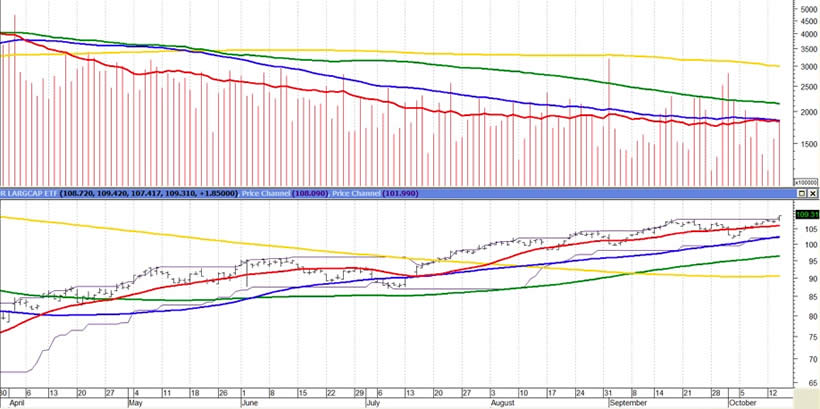
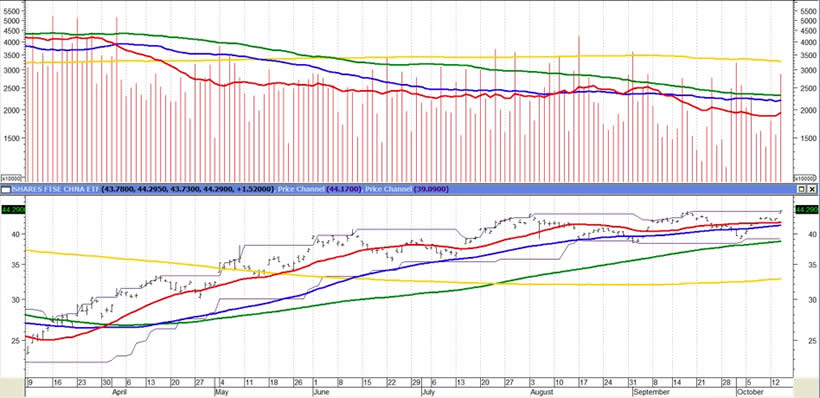
The stacking of the price and its moving averages of various lengths (21-days, 63-days, 126-days, and 252-days) is in an up trend for each of SPY and FXI. However, the stacking of the volume and its moving averages of the same lengths are stacked in a down trend for each of SPY and FXI.
Caution is warranted by this measure for both SPY and FXI.
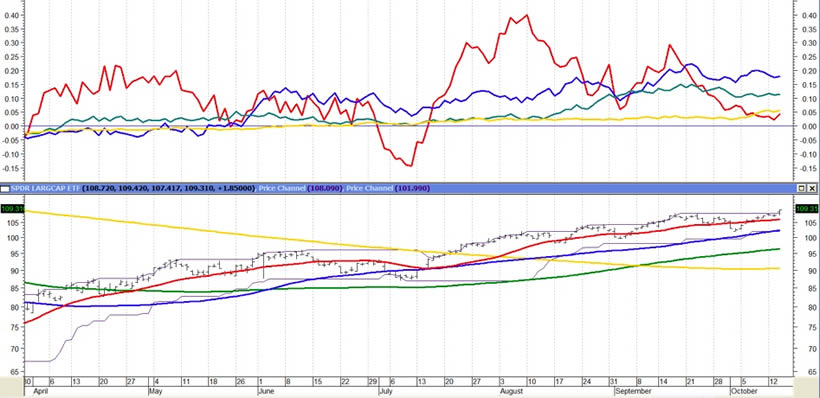
SPY Price and Volume Since 03/09/2009
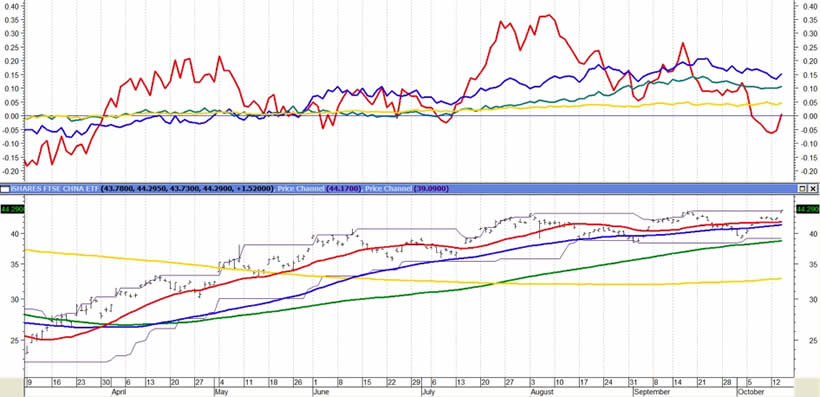
FXI Price and Volume Since 03/09/2009
Money Flow - On Balance Volume:
On Balance Volume (”OBV”) is the cumulative total of positive and negative volume. It is calculated by adding the day’s volume to a running cumulative total when the security’s price closes up, and subtracting the volume when the price closes down.
A rising OBV confirms a price trend. A declining OBV shows a weakening price trend. A divergence between OBV trend direction and price trend direction is a warning that the price trend may not continue.
The value of OBV is not important. The direction of the OBV line is important. A user should concentrate on the OBV trend and its relationship with the security’s price trend.
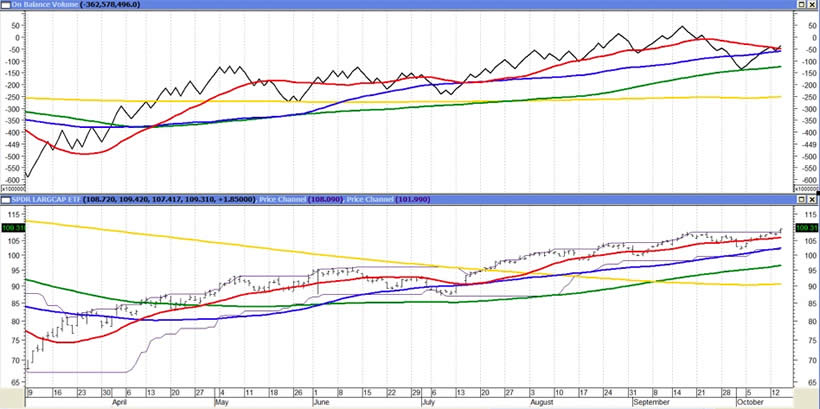
SPY Price and OBV Since 03/09/2009
For SPY, the OBV and its moving averages are stacked in a bullish order at the moment, although the OBV fell through its 21-day and 63-day levels before bouncing off its 126-day level. The OBV has since recovered somewhat, but is still below its high.
Caution is warranted according to this indicator.
FXI Price and OBV Since 03/09/2009
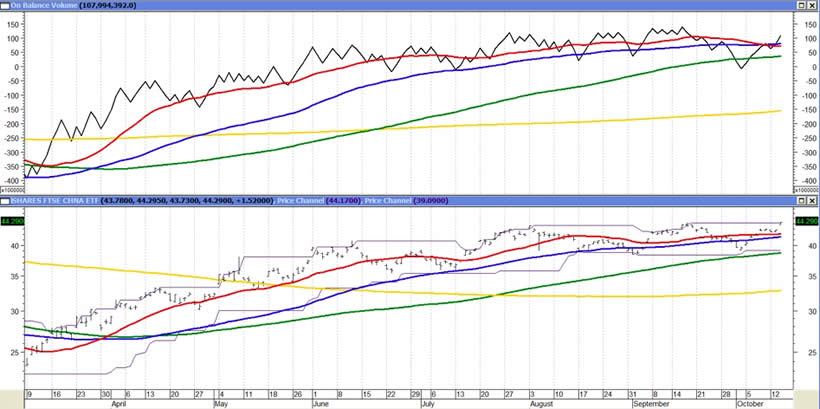
For FXI, the OBV took a deeper dive below its 126-day average, but has recovered to a level closer to its high than is the case for SPY.
Caution is still warranted, as some accumulation fatigue is apparent.
Money Flow - Chaikin Money Flow:
Chaikin Money Flow (”CMF”) is an oscillator (not trend following) that attempts to show the degree of buying or selling pressure on a security over a selected period of time.
StockCharts.com describes the formula for Chaikin Money Flow as “the cumulative total of the Accumulation/Distribution Values for [x default 21] periods divided by the cumulative total of volume for [x default 21] periods.”
StockCharts.com describes the formula for Accumulation/Distribution as “a value based on the location of the close, relative to the range for the period. We will call this value the “Close Location Value” or CLV. The CLV ranges from plus one to minus one with the center point at zero. There are basically five combinations: ( ( (C - L) - (H - C) ) / (H - L) ) = CLV 1. If the stock closes on the high, the top of the range, then the value would be plus one. 2. If the stock closes above the midpoint of the high-low range, but below the high, then the value would be between zero and one. 3. If the stock closes exactly halfway between the high and the low, then the value would be zero. 4. If the stock closes below the midpoint of the high-low range, but above the low, then the value would be negative. 5. If the stock closes on the low, the absolute bottom of the range, then the value would be minus one. The CLV is then multiplied by the corresponding period’s volume, and the cumulative total forms the Accumulation/Distribution Line.”
Three key attributes are: (1) whether the indicator is above or below zero, (2) the length of time the indicator is above or below zero, and (3) the magnitude of the positive or negative reading.
SPY Price and CMF Since 03/09/2009
For SPY, the CMF is (1) still above zero [accumulation], (2) has been above zero for 3 months and most of the past 6 months, and (3) the magnitude of the positive values for the 21-day figure have been deteriorating since August to an essentially neutral level.
Caution is warranted.
FXI Price and CMF Since 03/09/2009
For FXI, the CMF (1) has been below zero over the last few days and has recovered to just over zero, (2) has been above zero for most of the past 6 months, but with 4 short periods below zero, and (3) the magnitude of the positive position has been fading since August, culminating in a mild below zero position that is only just reverted to a minimal positive value.
Caution is warranted until a solid positive number is observed.
Volume By Price:
Volume By Price (”VBP”) shows the volume of trading that took place at each price range. The horizontal histogram at the left is on the same scale as the price shown on the right.
Larger histograms will result from either a high volume as the security passes through a price, or the security spending more time in the price range than in other ranges over the measured period (including through the price range up and down at different times). Smaller histograms will result from either a low volume as a security passes through a price, or the security spending less time in the price range over the measured period.
SPY Price and VBP Since 03/09/2009
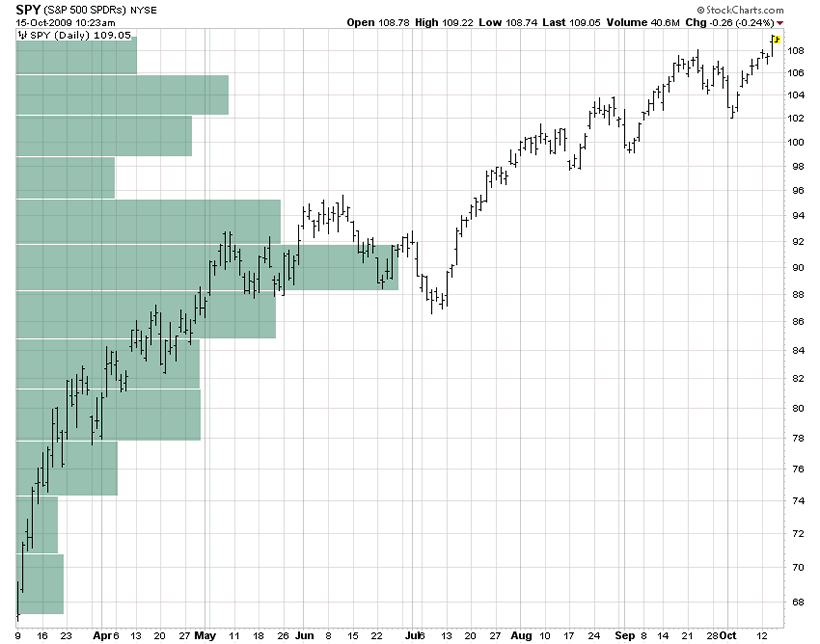
SPY has seen the most volume in the high 80’s and low 90’s and very little volume at the bottom in early March. The contraction of the histogram in the high 90’s probably reflects disbelief that the recovery from the July down draft would hold. Once the post-July recovery seemed to be real, the volume picked up as it did in April after the post-March low recovery began to attract followers. The chart shows that the great bulk of those buyers since March 9 are in a gain position (bought before the end of August). Whether they are skittish and likely to cash out or confident and likely to stay in for potential gain in not indicated by this type of chart.
Some people believe that price ranges with the highest volume are likely support or resistance areas. Taking that approach would tend to agree with price-based logic for support in the high 80’s to low 90’s for SPY.
FXI Price and VBP Since 03/09/2009
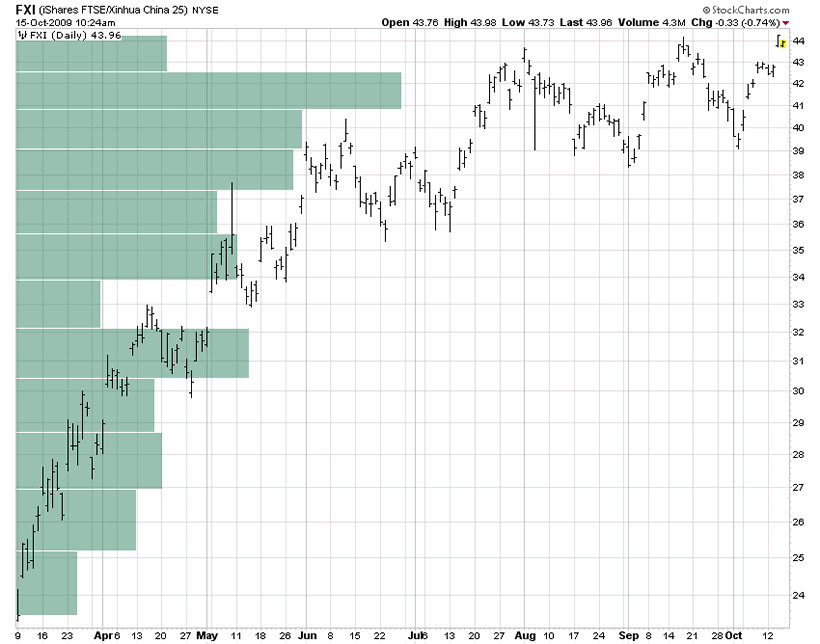
Unlike SPY which saw a bulge in volume mid-move since March 9 (partly due to some consolidation at mid-move prices), FXI has seen a general increase in volume as the price has risen. Only at the very top of the FXI price so far have we seen volume falling off. It deserves watching, but is inconclusive.
A large portion of FXI buyers since March 9 did so after August, and are in a shallower gain position than the bulk of SPY buyers since March 9.
Summary:
We are not big users of volume for analysis. Maybe we should increase our volume observations. We’ll think about that.
The flows of money are key to market action — prices go where money flows.
In writing this article, we mostly wanted to respond to reader request for information about volume as a follow-up to our article on volatility and probability based projection of the year-end price for the S&P 500. Nonetheless, we found this volume exercise to be useful and appreciate being prodded to do the study.
The idea that volume precedes price is attractive, but the degree of reliability of specific volume indicators has not been demonstrated to our satisfaction (or perhaps our study has not been extensive enough) to make volume other than collateral information at his point.
Most likely, we would be motivated by major volume trends or significant divergences, but not by fine movements in volume indicators.
That said, these volume indicators all seem to suggest some degree of trend exhaustion and that caution is in order.
Our price volatility analysis suggests a roughly 80% probability of a 9% price change range for SPY through year-end based on 3-month daily historical and options implied volatility. Price moving average trends suggest an upward bias in that range. Volume and some fundamentals suggest investors be alert for a negative bias.
Historical 3-month daily volatility for FXI, suggests a roughly 80% probability of a 8+% price change range by year-end. Price moving average trends suggest an upward bias in that range. Volume and some fundamentals suggest investors be alert for a negative bias.
Disclosure: We own SPY and FXI in some managed accounts
By Richard Shaw
http://www.qvmgroup.com
Richard Shaw leads the QVM team as President of QVM Group. Richard has extensive investment industry experience including serving on the board of directors of two large investment management companies, including Aberdeen Asset Management (listed London Stock Exchange) and as a charter investor and director of Lending Tree ( download short professional profile ). He provides portfolio design and management services to individual and corporate clients. He also edits the QVM investment blog. His writings are generally republished by SeekingAlpha and Reuters and are linked to sites such as Kiplinger and Yahoo Finance and other sites. He is a 1970 graduate of Dartmouth College.
Copyright 2006-2009 by QVM Group LLC All rights reserved.
Disclaimer: The above is a matter of opinion and is not intended as investment advice. Information and analysis above are derived from sources and utilizing methods believed reliable, but we cannot accept responsibility for any trading losses you may incur as a result of this analysis. Do your own due diligence.
Richard Shaw Archive |
© 2005-2022 http://www.MarketOracle.co.uk - The Market Oracle is a FREE Daily Financial Markets Analysis & Forecasting online publication.