


Stock Market Cycle Turning Points Analysis 15th July 2007
Stock-Markets / Cycles Analysis Jul 15, 2007 - 12:32 PM GMTBy: Andre_Gratian

A 3-dimensional approach to technical analysis
Cycles - Breadth - Price projections
Current Position of the Market.
SPX: Long-Term Trend - The 12-year cycle is still in its up-phase but, as we approach its mid-point some of its dominant components are topping and could lead to a severe correction over the next few months.
SPX: Intermediate Trend - The intermediate trend made its low on 6/26 and has already produced a rally to an all time high. But internals are weak and it is not clear how sustained this move will be.
Analysis of the short-term trend is done on a daily basis with the help of hourly charts. It is an important adjunct to the analysis of daily and weekly charts which determines the course of longer market trends.
Daily market analysis of the short term trend is reserved for subscribers. If you would like to sign up for a FREE 4-week trial period of daily comments, please let me know at ajg@cybertrails.com .
Overview
After consolidating for over a month, equity indices have risen to new highs and the SPX briefly and finally surpassed its 2000 high of 1552.87. The Russell 2000 was the laggard once again, coming just short of its June 4th high. The Nasdaq, and especially the Nasdaq 100 (NDX) had been forecasting the imminence of this move and led the other indices all the way.
So are we in a new bull market leg ? And how far will it carry? The internals of the market are not terrific, and unless it changes, this move may be living on borrowed time.
The Light Crude continuous contract is now within one point of its $75 target which was established when it broke above 62. After reaching 75, it should enter a period of consolidation.
What's Ahead?
Momentum:
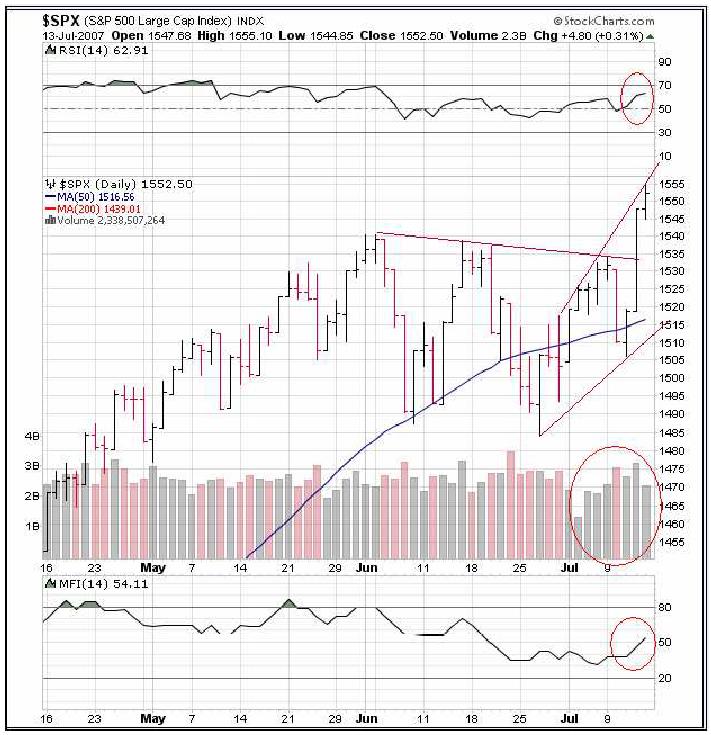
Let's analyze this three-month chart of the SPX (Courtesy of StockCharts). Our only concern is the break-out and what it is telling us. There are a lot of negatives:
- Starting at the bottom, the money flow indicator is not supporting this move. It did not start rising until the last 2 days and is still way below its former high while the SPX is at an all-time high.
- The volume patterns are also problematic. Light volume patterns have characterized up-days, while heavy volume the down-days. This goes back to the beginning of the correction in June, but is even more apparent in this last surge.
- At the top of the chart, the RSI is faring a little better than the money flow index, but it is already beginning to flatten out at a lesser level than its previous highs. So the chart momentum indicator is also flashing a warning signal by posting negative divergence to the price.
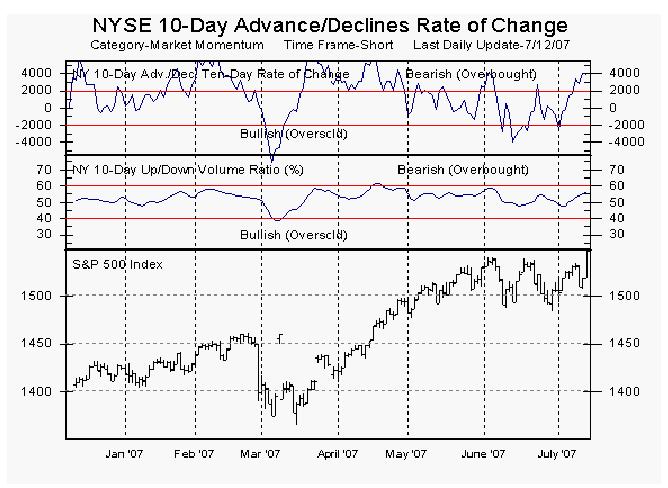
This 10-day moving average of the A/D and up/down volume (courtesy Market Gauge) are giving bearish signals.
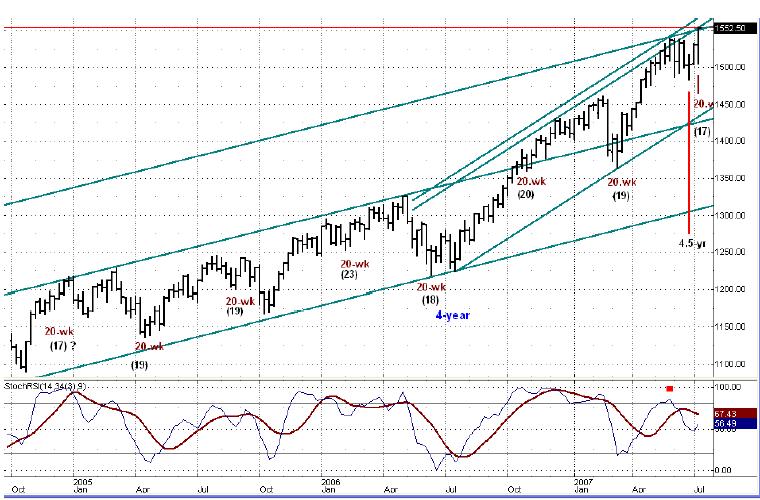
Now let's look at the weekly chart.
More negatives appear on this chart, with the index hitting the top of its channels. The two top channel lines intersect just about where the price closed this week. This should prove to be a very strong resistance level and is also an inflection point. The negatives listed above are probably in recognition that the odds are very slim that significant continued progress will be made. If it happens, expect much of the technical negativity to disappear.
Note also that negative divergence still exists in the momentum indicator below. A confirmed buy signal in that indicator normally comes when the thin line crosses above the thick line. In spite of the strength of the last 3 weeks, this is still far from happening.
We'll refer to this chart again when we discuss cycles.
Cycles
There are two major cycle series which are like fraternal twins born in the womb of the number 360. One of them emanates from the number 72, which is one fifth of 360. This series revolves around the number 9, its multiplications and divisions, One fourth of 72 is 18, and this is the number that J.M. Hurst chose to delineate the primary cyclical pattern of the stock market. He starts with 18 years and subdivides this number further all the way down to 1.625 weeks. We will only concern ourselves with the first major segment which is the 4.5-yr cycle because it is now almost 4.5 years from March 2003 which, according to the Hurst analysts was the 18-yr cycle low, and we should have a significant low in this time frame lasting until September.
The other cycle series which revolves around the number 10 was discovered by Samuel (Bud) Kress of Sine Scope. Starting with the 120-yr Master Cycle, some of the most dominant cycles are the 60,40,30,12,10,and 2 years. We'll keep those in mind in the next few months and years when we discuss longer-term cycles.
Hurst also favored the 10 and 20-wk cycles which clearly belong in the Kress series. The 20-week cycle is also due to make its low in this time frame, ideally in the last week of July. Some Hurst analysts had expected a nesting of the 20-week and 4.5yr cycle to occur in the late July time period. I am not sure why, because these two cycles are not really related and in 2003 they bottomed about a month apart. But for now, the main question is "have both of these cycles already bottomed?" Could the 4.5 year have made its low in its 51st month? And if not, what is it that is causing the market strength since 6/26?
The same question can be asked of the 20-week cycle. Did it make its low in the 17th week as it did back in December 2005? On the weekly chart above, I have recreated the lows of the past 20w, cycles to the best of my ability. As you can see, these are not consistently 20 weeks apart, but can vary by up to 3 weeks. If this is the case, the 20-wk cycle could very well have bottomed in its 17th week and is responsible for the latest surge which started last Wednesday in the index.
There were short-term cycle lows which coincided with the two last dips and rallies, but it does not seem likely that they would generate that much strength as they turned up unless they were assisted by a longer cycle.
At this point, these are all assumptions that can only be verified when we see what the market action brings us between now, the week of 7/23, and September. To muddle things a little further, there is a 9-wk cycle bottoming during the week of 7/23. If we get enough weakness into that time frame, it will be said that the 20-week cycle caused it.
Cycles are land marks which guide us along the market path and they can be difficult to dissect at times. Fortunately we have some good technical indicators to help us sort them all out.
We must also keep in mind that one of the most dominant long term cycles, the 2-yr cycle, is in the process of topping here, and will start to bring downward pressure on the market between now and the end of the year. Therefore, whatever market activity is taking place here is likely to be the beginning of a topping pattern which could last several more weeks.
Projections
We'll let the cycles sort themselves out but in the meantime, we can get a sense of how far the current rally can take us. Actually, it looks as if we have already nearly reached the projection zone. Fibonacci targets cluster between 1560 and 1570, while Point & Figure counts range from 1555 and 1570. Hopefully there will be some consolidation in the next day or two which will give us a clearer final count and serve as a launching platform for the final small up-leg of the current rally.
Breadth
The breadth supporting the rally of the last two days was very poor. This is not a good sign and suggests that the market has overextended itself and is in need of consolidation. It does not necessarily mean that the rally is over, because hardly any distribution has taken place as represented by the Point and Figure chart. This is why I think that we are likely to consolidate for a day or two and then finish the rally in the projection zone mentioned above. Since next week is options expiration week, we could extend this rally all the way into next Friday.
Market leaders & Sentiment
Both GE and the NDX made new highs on Friday. This stock and that index have usually played the part of canaries in determining important tops. Since they are still rising in concert with the SPX and other indices, it is improbable that the end of the current rally will also mark the end of the bull market. Most likely, several more short-term rallies and declines will be required to form a topping pattern. By then, ideally, underperformance in GE and the NDX will be clearly visible.
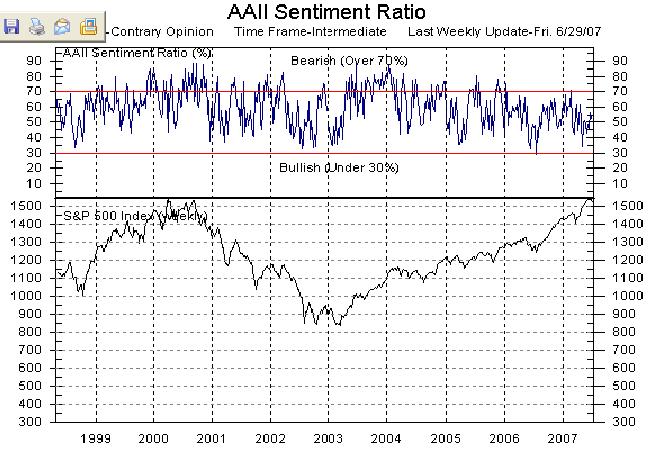
Also, although sentiment is becoming more negative for the stock market, it is not yet at the level which is associated with important tops. The following AAII index (courtesy of Market Gauge) is only slightly above neutral. It would have to reach the red line to signal that an important top is at hand.
Summary
The stock market has completed its correction and is moving on. Poor internals suggest that a shortterm top will soon be in place but there are indications that this will only be the first in a series of rallies and declines which are necessary to give us the degree of distribution required for an important top.
It appears as if the 4.5-yr cycle may have bottomed early, 3 months ahead of schedule, but this is an assumption which can only be verified by future market action.
A market advisory service should be evaluated on the basis of its forecasting accuracy and cost. At $25.00 per month, this service is probably the best all-around value. Two areas of analysis that are unmatched anywhere else -- cycles (from 2.5-wk to 18-years and longer) and accurate, coordinated Point & Figure and Fibonacci projections -- are combined with other methodologies to bring you weekly reports and frequent daily updates.
The following are examples of unsolicited subscriber comments:
What is most impressive about your service is that you provide constant communication with your subscribers. I would highly recommend your service to traders. D.A.
Andre, You did it again! Like reading the book before watching the movie! B.F.
i would like to thank you so much for all your updates / newsletters. as i am mostly a short-term trader, your work has been so helpful to me as i know exactly when to get in and out of positions. i am so glad i decided to subscribe to turning points. that was one of the best things i did ! please rest assured i shall continue being with turning points for a long while to come. thanks once again ! D.P.
Andre, I must say that your service is fantastic, since I have signed up for your 30 day free trial I have made two successful trades. When my 30 day free trial is up please let me know so I can sign up as a regular member. I have tried a lot of services out there and I must say yours tops everything. Please use this testimonial if you like. S.W.
But don't take their word for it! Find out for yourself with a FREE 4-week trial. Send an email to ajg@cybertrails.com .
By Andre Gratian
MarketTurningPoints.com
If this information is of value to you, you should consider our trial subscription offer (above). Daily updates consist of a Morning Comment, Closing Comment (which occasionally includes an updated hourly chart of the SPX to illustrate the analysis), and at least one or more updates during the trading session whenever it is warranted by market action. These updates discuss phase completions, give projections, potential reversal points, and whatever else may be pertinent to the short-term trend.
“By the Law of Periodical Repetition, everything which has happened once must happen again, and again, and again -- and not capriciously, but at regular periods, and each thing in its own period, not another’s, and each obeying its own law … The same Nature which delights in periodical repetition in the sky is the Nature which orders the affairs of the earth. Let us not underrate the value of that hint.” -- Mark Twain
You may also want to visit the Market Turning Points website to familiarize yourself with my philosophy and strategy.www.marketurningpoints.com
Disclaimer - The above comments about the financial markets are based purely on what I consider to be sound technical analysis principles uncompromised by fundamental considerations. They represent my own opinion and are not meant to be construed as trading or investment advice, but are offered as an analytical point of view which might be of interest to those who follow stock market cycles and technical analysis.
Andre Gratian Archive |
© 2005-2022 http://www.MarketOracle.co.uk - The Market Oracle is a FREE Daily Financial Markets Analysis & Forecasting online publication.