


Stock Market Dumb Money Indicator Says Investors are Extremely Bullish
Stock-Markets / Stock Market Sentiment Dec 20, 2009 - 11:43 AM GMTBy: Guy_Lerner

 The holidays are approaching, and I am lucky enough to be traveling this year with my family. So there won't be any comments attached to this week's sentiment charts. I don't have the time, and I won't waste your time. That's o.k. because as you know nothing has really changed in this market for the last three months anyway. Prices have been range bound, and investors continue to be overly bullish, insiders continue to sell, and the smart money remains indifferent.
Most importantly, I want to wish everyone a happy and festive holiday season. Thanks for reading my blog. I am on vacation, and I will pick up after Christmas.
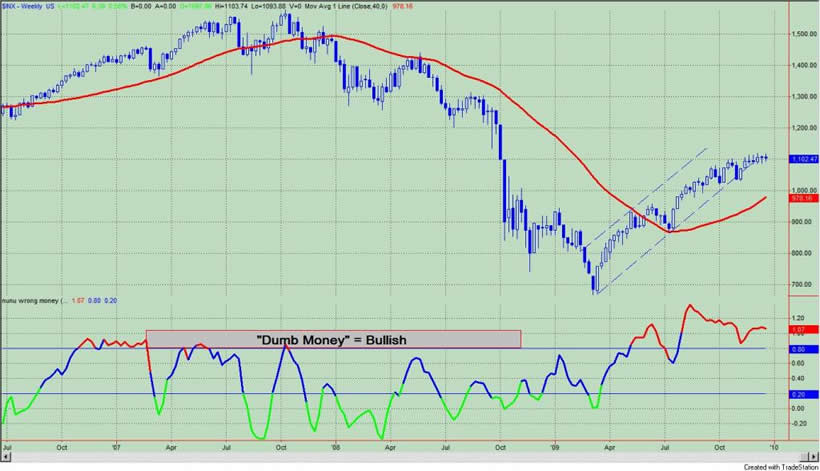
The "Dumb Money" indicator, which is shown in figure 1, looks for extremes in the data from 4 different groups of investors who historically have been wrong on the market: 1) Investor Intelligence; 2) Market Vane; 3) American Association of Individual Investors; and 4) the put call ratio. The "Dumb Money" indicator shows that investors are extremely bullish.
Figure 1. "Dumb Money" Indicator/ weekly
The "Smart Money" indicator is shown in figure 2. The "smart money" indicator is a composite of the following data: 1) public to specialist short ratio; 2) specialist short to total short ratio; 3) SP100 option traders. The Smart Money indicator is neutral.
Figure 2. "Smart Money" Indicator/ weekly
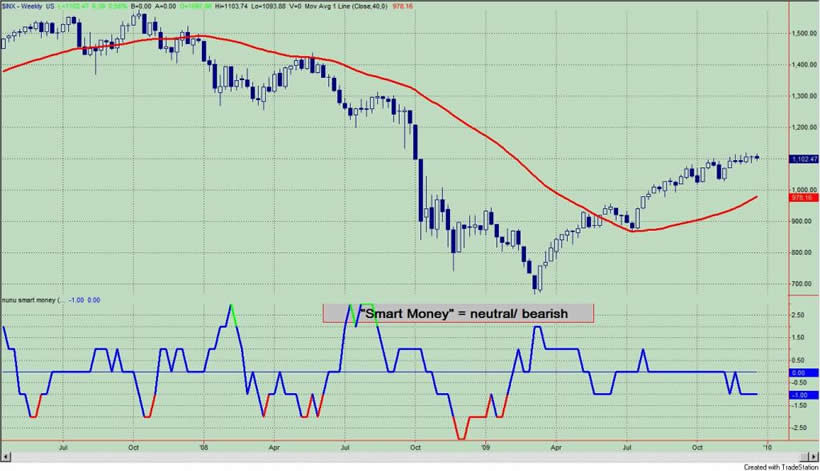
Figure 3 is a weekly chart of the S&P500 with the InsiderScore "entire market" value in the lower panel. From the InsiderScore weekly report we get the following three insights: 1) "sentiment remained squarely in bearish territory"; 2) "there's no disguising the fact that insiders across all sectors continue to exhibit a serious sell bias"; 3) "the insiders who have been buying have shown little in the way of conviction".
Figure 3. InsiderScore Entire Market/ weekly
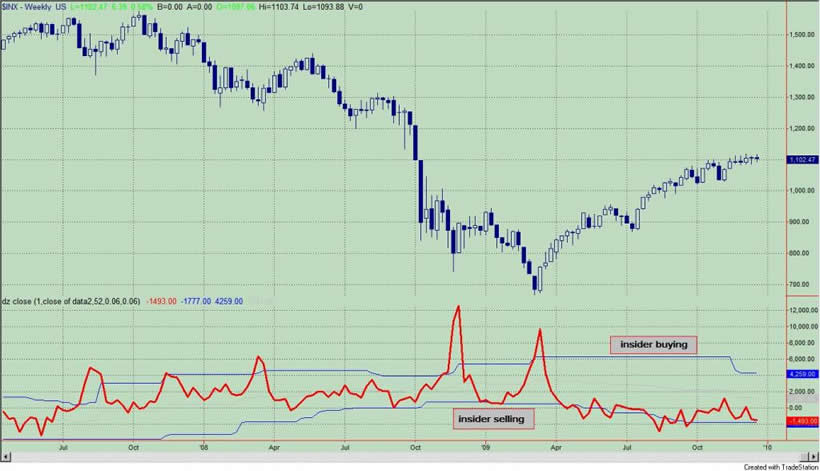
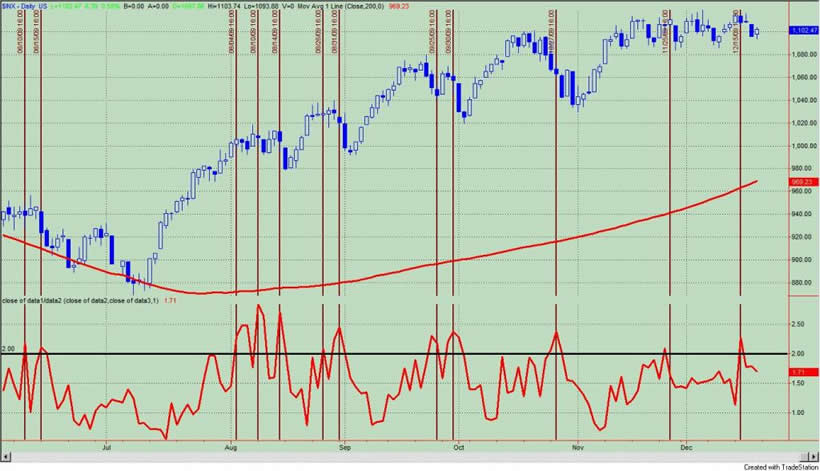
Figure 4 is a daily chart of the S&P500 with the amount of assets in the Rydex bullish and leveraged funds versus the amount of assets in the leveraged and bearish funds. Not only do we get to see what direction these market timers think the market will go, but we also get to see how much conviction (i.e., leverage) they have in their beliefs. Typically, we want to bet against the Rydex market timer even though they only represent a small sample of the overall market. As of Friday's close, the assets in the bullish and leveraged funds were greater than the bearish and leveraged by 1.71 to 1, and this ratio is shown in the lower panel.
Figure 4. Rydex Bullish and Leveraged v. Bearish and Leveraged/ daily
By Guy Lerner
http://thetechnicaltakedotcom.blogspot.com/
Guy M. Lerner, MD is the founder of ARL Advisers, LLC and managing partner of ARL Investment Partners, L.P. Dr. Lerner utilizes a research driven approach to determine those factors which lead to sustainable moves in the markets. He has developed many proprietary tools and trading models in his quest to outperform. Over the past four years, Lerner has shared his innovative approach with the readers of RealMoney.com and TheStreet.com as a featured columnist. He has been a regular guest on the Money Man Radio Show, DEX-TV, routinely published in the some of the most widely-read financial publications and has been a marquee speaker at financial seminars around the world.
© 2009 Copyright Guy Lerner - All Rights Reserved
Disclaimer: The above is a matter of opinion provided for general information purposes only and is not intended as investment advice. Information and analysis above are derived from sources and utilising methods believed to be reliable, but we cannot accept responsibility for any losses you may incur as a result of this analysis. Individuals should consult with their personal financial advisors.
Guy Lerner Archive |
© 2005-2022 http://www.MarketOracle.co.uk - The Market Oracle is a FREE Daily Financial Markets Analysis & Forecasting online publication.