


Stock Index Analysis for S&P and Nasdaq
Stock-Markets / Stock Index Trading Dec 28, 2009 - 01:56 AM GMTBy: Piazzi

 Hope you all had a Merry Christmas, and are en route to a wonderful New Year.
In a post of December 11, I said: In June, index looked heading for a good drop, or correction, but it turned around without giving much and rallied. In November, Index looked very weak internally and cyclically, it looked ready to break, but it recovered without giving much. It has been my proposition for months that the bears of the last drop (before March) have been little significance to the market action (other than providing timely squeezes for rallies), and I think they are totally out of the game at this point. Market needs new bears with capital and conviction.
And, more importantly:
So, the question is if those who can short with capital and conviction did not do so in July or November, why would they aggressively sell here in December with Santa and year-end-bonuses on the horizon?
And
My plans are just to focus on the ongoing range and ignore everything else.
Then I kept posting the range charts of NDX and SPX with my targets
Sometimes, the simplest of charts, and a trading plan may be all that one needs.
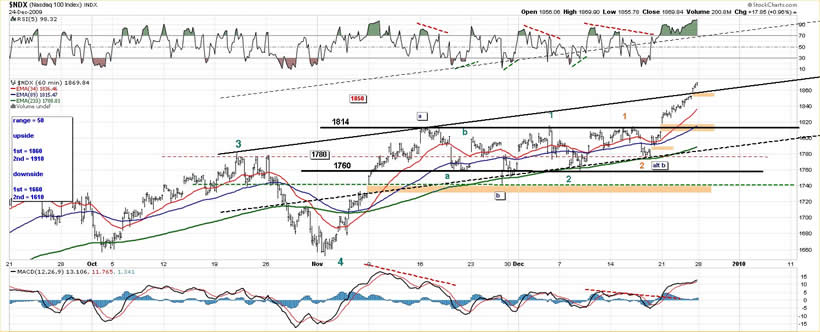
Here is the updated range chart of NDX
I realized that I had made a mistake calculating the first range target. Here, I have corrected it. So, the first target, 1860, has been achieved and surpassed – Congratulations to all who acted and benefited. I mean it, with all the noise coming out of bears saying GDP this, unemployment that, Greece-to-hell-in-a-hurry, Spain and Portugal to follow, and whatever the hell not, staying with a technical setup and pulling the trigger on a trade solely based on the charts may be hard.
Don’t get me wrong, I am not arguing against the fundamental arguments of any fundamentalist. I actually think they are right. But, as I have said, time and time again, market and fundamentals may, at times, dance to very different tunes.
It was in September that the weekly chart broke out. Since then, NDX has held very well. Some of you may remember this weekly chart that I have posted at times
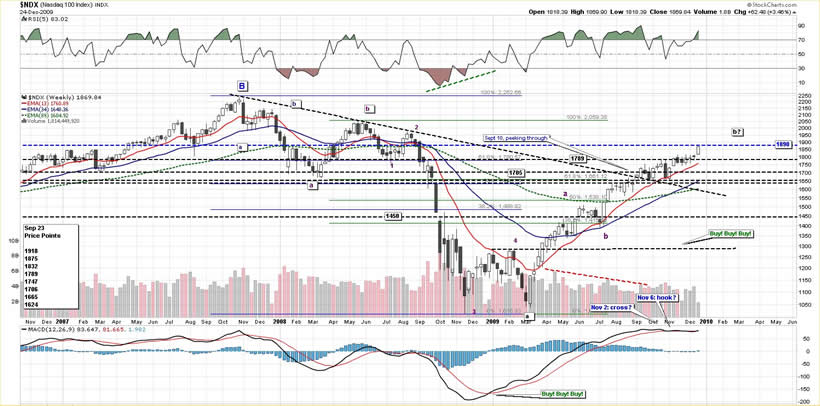
There is some significant resistance around 1890 area, and after that we have the high of last year. As for support, we have a multitude of levels. What interest me in the above chart are the rising MAs and the appearance of hook on MACD. It is a very positive chart with a very positive technical profile.
Let’s zoom in
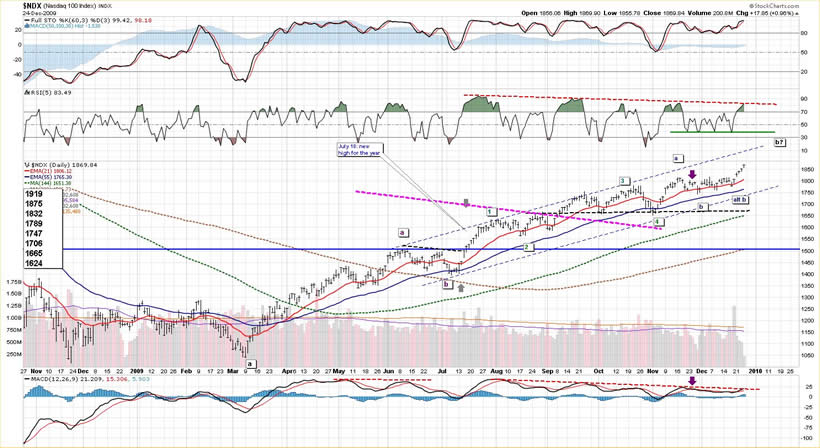
Index is overbought, but that does not mean much in an uptrend. The recent move did not have a lot of volume, and it would be interesting to see how the index behaves when volume comes back if it comes back.
I can count the entire thing as an impulse, but I’m gonna stay with abc’s for now
There is a tricky part with the placing of what I am counting as minor wave B (dark blue). I think I can place it at November 27 as well as at December 17 lows; each has a drastically different wave projection.
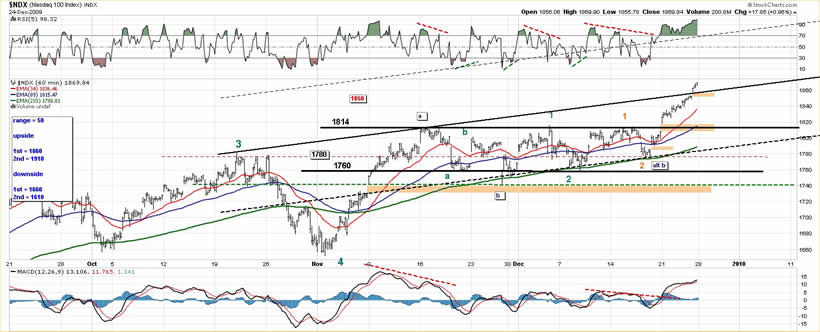
Let’s zoom in on the 60-min again
As you see, depending on where I place minor wave B, the wave projection changes significantly. But, that does not matter immediately. As long as NDX stays above 1814, it is just doing fine. If it breaks below that it may put the current uptrend in jeopardy.
Index can drop all the way to 1815 and still be OK. Below that, we have the range of 1760-1814 as a buffer zone. In other words, I cannot see a favorable risk/reward scenario on the long side right now.
The 60-min chart is way over bought. That’s OK, that’s what I’d like to see on a 3rd wave. But, that’s not my ideal setup for a new entry on the long side. It can ride the Santa Sled forever or can correct at any point.
There are four unfilled gaps on the chart above. The last one may very well be an exhaustion gap considering how overbought RSI is.
Getting back to the range, I think the first targets can be attacked aggressively. But the second target, IMO, should be played more conservatively. That’s because upon a breakout
1. Many are doubtful and wait for, well, whatever
2. Many are caught off guard holding shorts and, praying for a pullback and a break even
By the time the first target is achieved, everybody knows that the range was indeed a correct and fruitful setup; many shorts will have covered, and many doubters will have tip-toed in. So, chances of profit-taking/rotation/distribution increase.
We will see how it corrects when it corrects on the lower frames and we’ll decide what to do then.
It is good for the market to come out of a range being led by the tech sector. That shows a propensity towards risk.
This is a weekly chart of S&P that we have seen before
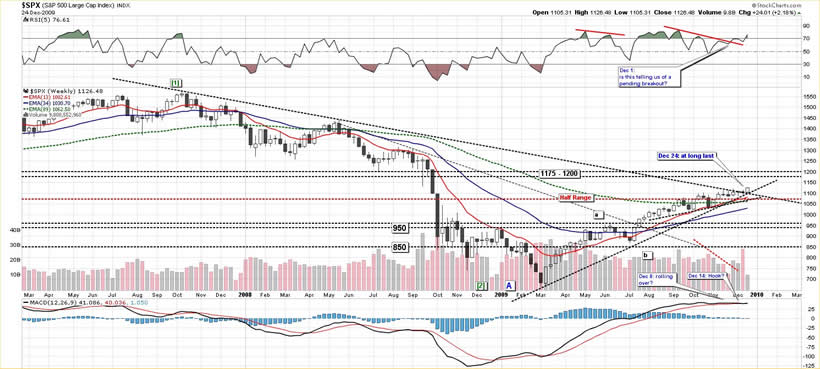
In the beginning of December, I pointed to RSI and wondered if its action was a harbinger of a pending breakout.
Well, we have our breakout now. There seems to be a lot of air above, and some solid earth below. There really is not much technical resistance before the 1175-1200 area. One could point to 1145-1150 as possible resistance, and that’s about all I see on the weekly frame.
We have quite a bit of support beneath, but the technical picture is not as well developed as NDX
Let’s zoom in
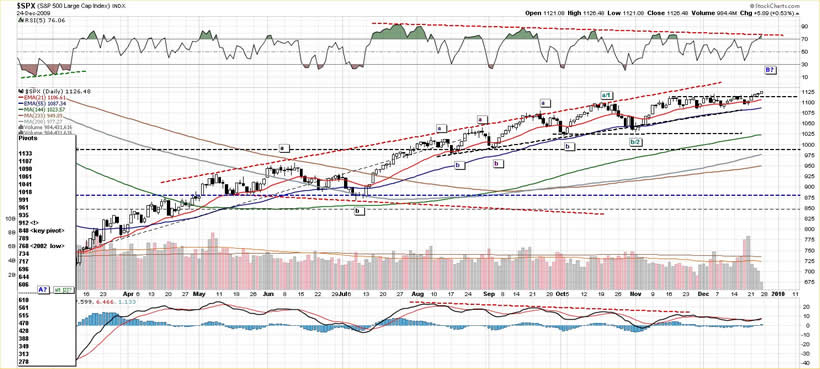
It is difficult to view the advance from July as an impulsive set of waves. I looks more like a series of abc’s. The overlapping waves, the continuously decreasing momentum, and low volume advances have been main contributors to the stealth nature of the recent moves. They get the bears all worked up that the top is finally in, only to be squeezed into another rally.
Let’s zoom in
This is the same 60-min chart that I have posted a number of times with my range targets
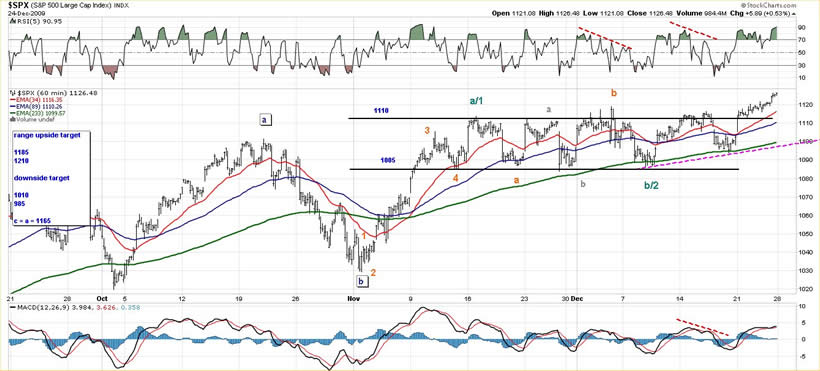
So far, S&P has been an underachiever compared to NDX. It may offer a better risk/reward entry when we finally get a correction. Regardless, as long as index is above 1110, it is in good shape, and the 1085-1110 range should act as a buffer zone.
For now, as long as index stays above 1080, I would ignore bears, and pay more attention to technicals, the weekly chart and its breakout, and the daily chart and it MA alignment, and the price action with respect to support levels and MAs.
You have done the hard job of pulling the trigger on a range breakout. Now is the time for position management and prudence. One shall not let a winner turn into a loser, and if the winner stays a winner, one may entertain a systemic increase in one’s position size
This coming week is a short week and volume may stay light.
Bond yields have been on the rise
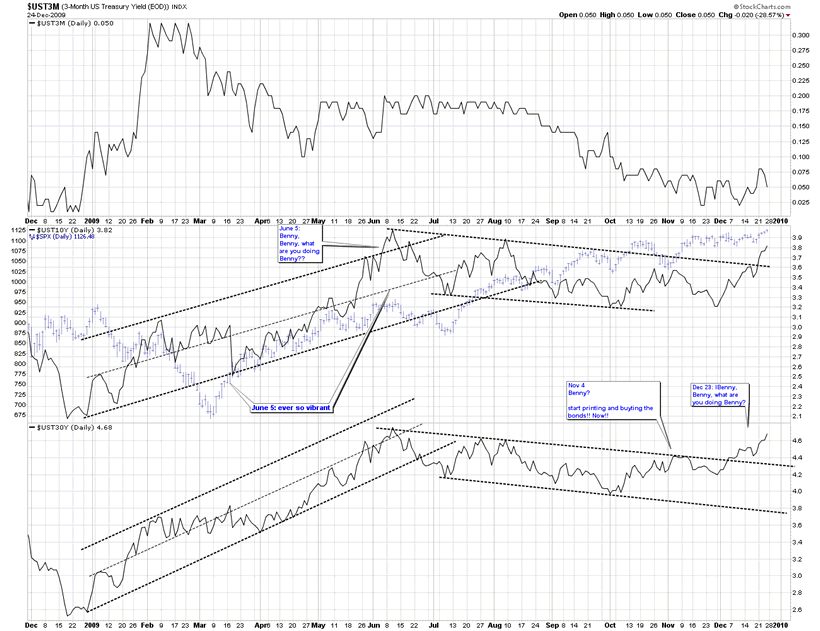
This may make it more expensive for those who need to finance their ongoing operations. I am not sure what should happen to force, or lure big money into long-dated treasuries. Some may say a market crash or a sharp sudden correction may do just that. For whatever it’s worth, this is a US bond auction week.
Happy Holidays!
By Piazzi
http://markettime.blogspot.com/
I am a self taught market participant with more than 12 years of managing my own money. My main approach is to study macro level conditions affecting the markets, and then use technical analysis to either find opportunities or stay out of trouble. Staying out of trouble (a.k.a Loss) is more important to me than making profits. In addition to my self studies of the markets, I have studied Objective Elliott Wave (OEW) under tutorship of Tony Caldaro.
© 2010 Copyright Piazzi - All Rights Reserved Disclaimer: The above is a matter of opinion provided for general information purposes only and is not intended as investment advice. Information and analysis above are derived from sources and utilising methods believed to be reliable, but we cannot accept responsibility for any losses you may incur as a result of this analysis. Individuals should consult with their personal financial advisors.
© 2005-2022 http://www.MarketOracle.co.uk - The Market Oracle is a FREE Daily Financial Markets Analysis & Forecasting online publication.