


Stock Market Bullish Investor Sentiment At Tipping Point?
Stock-Markets / Stock Market Sentiment Jan 03, 2010 - 12:03 PM GMTBy: Guy_Lerner

 From an investor sentiment perspective there is very little to like about the current US equity market. The "dumb money" continues to be bullish to an extreme. The "smart money" is neutral to bearish. Company insiders continue to be relentless in their selling. The Rydex market timers are their most bullish since mid August. With most investors in the bullish camp, at some point the market will reach its tipping point, and it is my expectation that this will be sooner than later. After all, who is left to buy if everyone is so bullish?
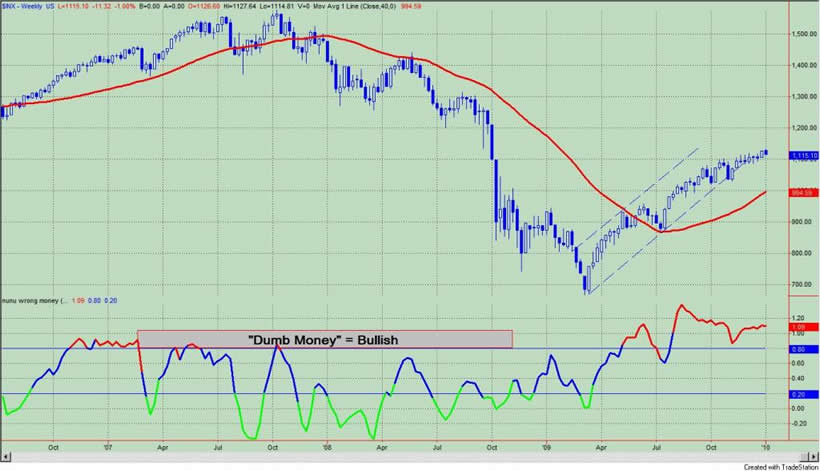
The "Dumb Money" indicator, which is shown in figure 1, looks for extremes in the data from 4 different groups of investors who historically have been wrong on the market: 1) Investor Intelligence; 2) Market Vane; 3) American Association of Individual Investors; and 4) the put call ratio. The "Dumb Money" indicator shows that investors remain extremely bullish.
Figure 1. "Dumb Money" Indicator/ weekly
The "Smart Money" indicator is shown in figure 2. The "smart money" indicator is a composite of the following data: 1) public to specialist short ratio; 2) specialist short to total short ratio; 3) SP100 option traders. The Smart Money indicator is neutral to bearish.
Figure 2. "Smart Money" Indicator/ weekly
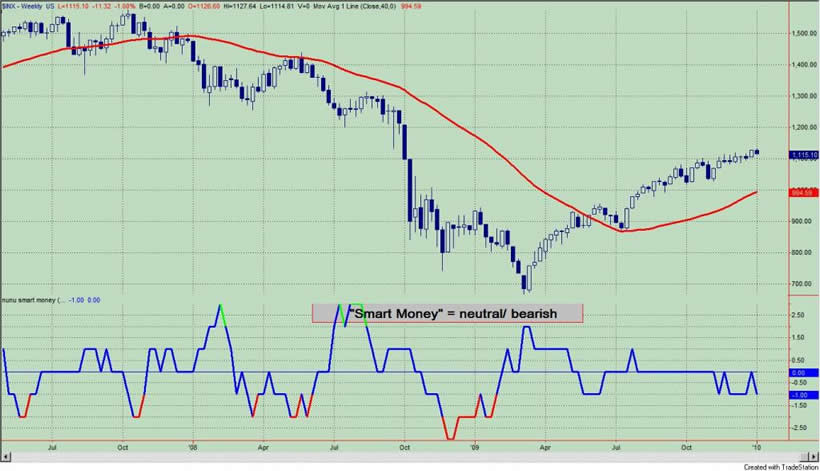
Figure 3 is a weekly chart of the S&P500 with the InsiderScore "entire market" value in the lower panel. From the InsiderScore weekly report we get the following two insights: 1) The S&P500 ended the year with selling as companies with selling outnumbered companies with buying by a nearly 9-to-1 ratio; 2) in the Russell 2000, companies with selling outnumbered companies with buying by a 3-to-1 ratio.
Figure 3. InsiderScore Entire Market/ weekly
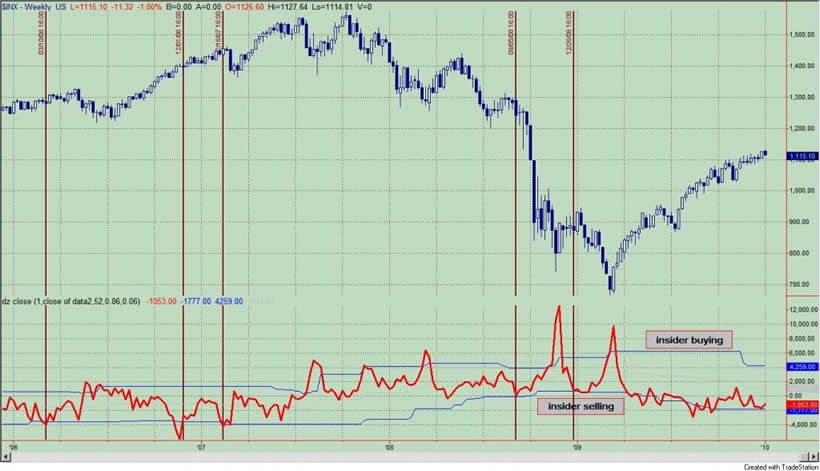
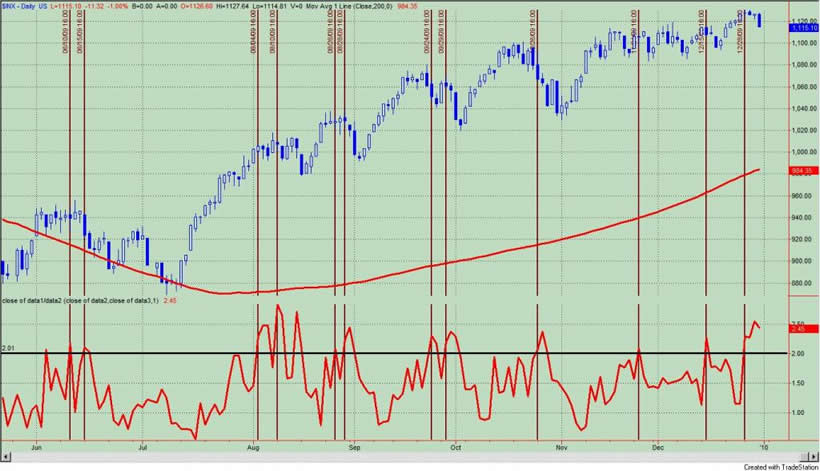
Figure 4 is a daily chart of the S&P500 with the amount of assets in the Rydex bullish and leveraged funds versus the amount of assets in the leveraged and bearish funds. Not only do we get to see what direction these market timers think the market will go, but we also get to see how much conviction (i.e., leverage) they have in their beliefs. Typically, we want to bet against the Rydex market timer even though they only represent a small sample of the overall market. As of Friday's close, the assets in the bullish and leveraged funds were greater than the bearish and leveraged by 2.45 to 1, and this ratio is shown in the lower panel. Throughout this rally when the ratio got above 2, it usually marked a short term trading top (as noted by the maroon colored vertical bars).
Figure 4. Rydex Bullish and Leveraged v. Bearish and Leveraged/ daily
By Guy Lerner
http://thetechnicaltakedotcom.blogspot.com/
Guy M. Lerner, MD is the founder of ARL Advisers, LLC and managing partner of ARL Investment Partners, L.P. Dr. Lerner utilizes a research driven approach to determine those factors which lead to sustainable moves in the markets. He has developed many proprietary tools and trading models in his quest to outperform. Over the past four years, Lerner has shared his innovative approach with the readers of RealMoney.com and TheStreet.com as a featured columnist. He has been a regular guest on the Money Man Radio Show, DEX-TV, routinely published in the some of the most widely-read financial publications and has been a marquee speaker at financial seminars around the world.
© 2009 Copyright Guy Lerner - All Rights Reserved
Disclaimer: The above is a matter of opinion provided for general information purposes only and is not intended as investment advice. Information and analysis above are derived from sources and utilising methods believed to be reliable, but we cannot accept responsibility for any losses you may incur as a result of this analysis. Individuals should consult with their personal financial advisors.
Guy Lerner Archive |
© 2005-2022 http://www.MarketOracle.co.uk - The Market Oracle is a FREE Daily Financial Markets Analysis & Forecasting online publication.