


The Bullish Stock Market Stampede from March ’09 ends abruptly in January ’10
Stock-Markets / Stock Index Trading Feb 07, 2010 - 05:43 AM GMTBy: Joseph_Russo

Shortly following the Dow’s print high in late January, it became clear that the markets forward looking mechanism suddenly shifted into reverse. Well before the fact, we were alerting subscribers of a looming top in late December or January.
Turn-bar analysis is one of the ways we keep members abreast of pivotal market turning points. Back in October of 2009, when most everyone else was calling for an imminent crash, we alerted our readership that new highs were likely throughout November and into the dawn of the current decade.
Once the pullback into December reversed, we made the case for a top on 11-January 2010.
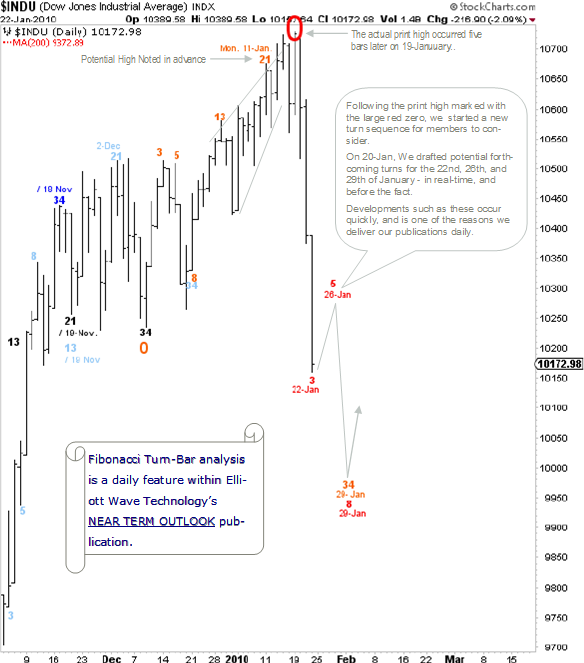
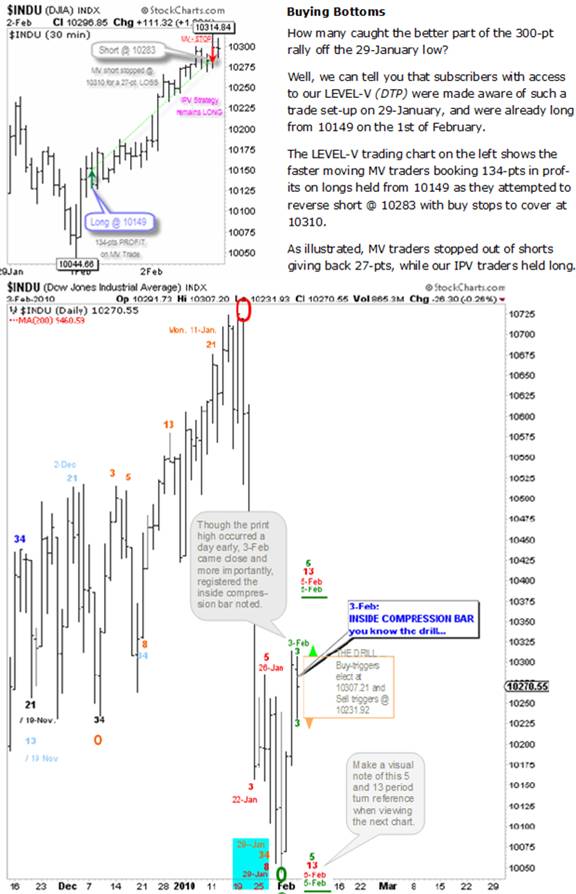
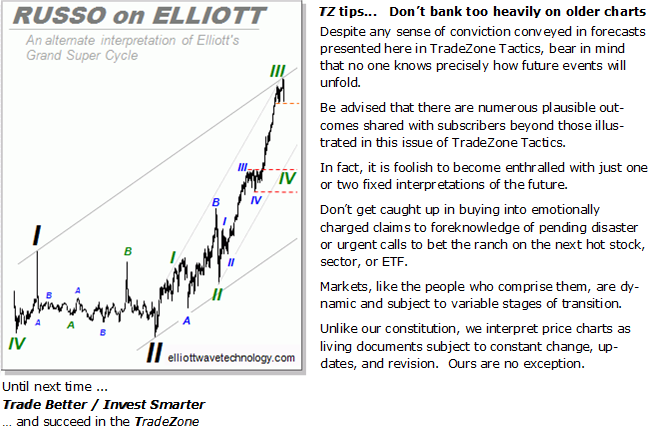
Here at Elliott Wave Technology, we are big believers in providing membership with high concentrations of visual chart-based graphics. As such, charts drafted for each issue convey clear and actionable forecasting guidance.
This 25-Jan turn-bar chart contains an additional piece of actionable information, an INSIDE COMPRESSION bar notice. We often include this type of ancillary technical insight to provide a higher level of preparedness for our readers.
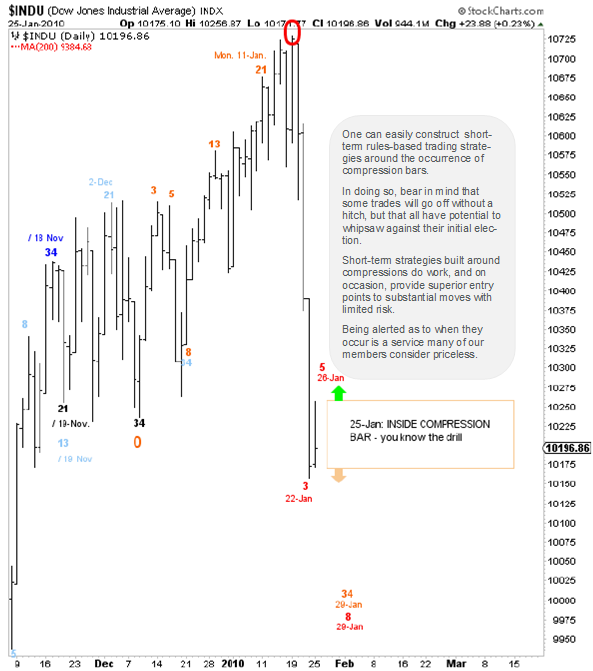
Inside bars occur when the range of a price bar remains confined within the boundaries of its previous bars range. Inside bars can and do occur across every timeframe be it daily, monthly, weekly, or intraday.
Inside bars indicate the presence of a temporary state of compression, which suggests that as the next bar moves above or beneath the previous bars compressed range, it will release the built-up energy and continue to move price in the direction of release. Such release of compressed energy is generally short-term in nature, but in some instances, price moves out of inside bars may mark intermediate-term reversals from key turn pivots, or an accelerating continuation of the current trend in force.
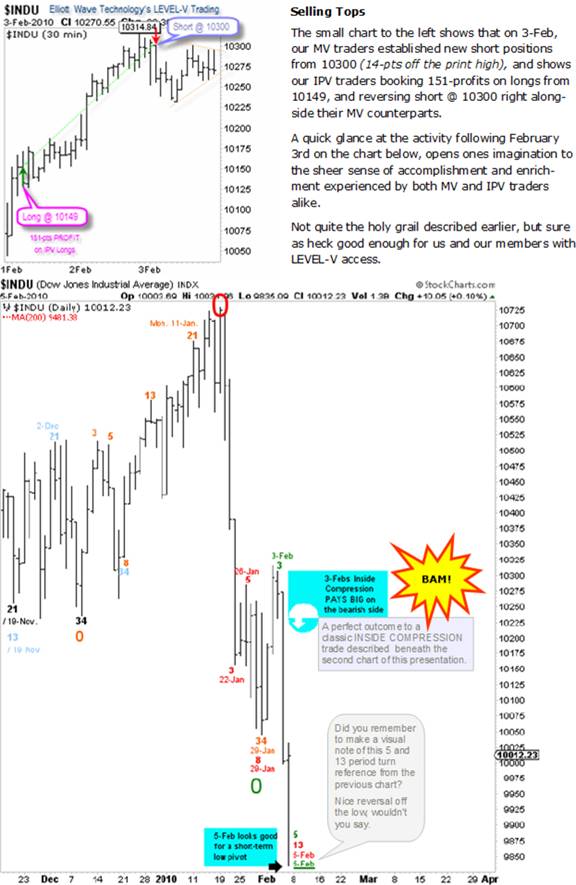
Wrapping up our recent tactical outcomes at LEVEL-V
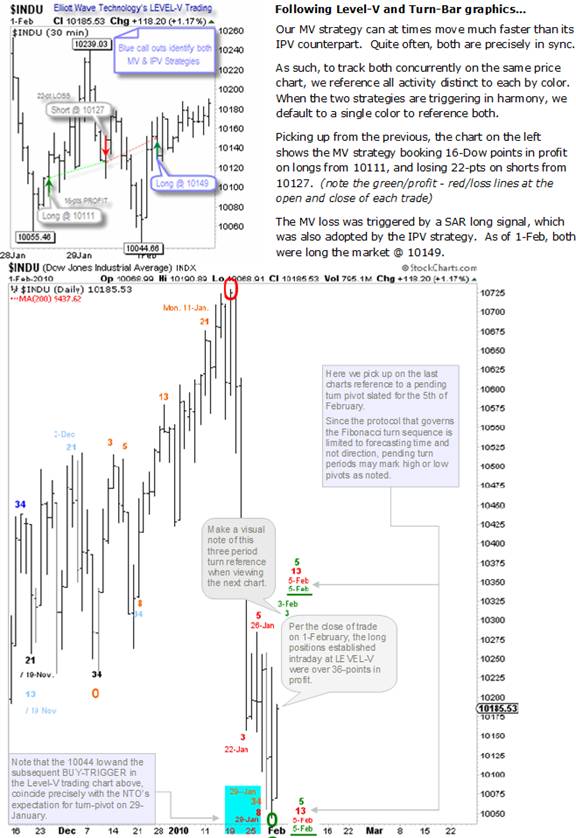
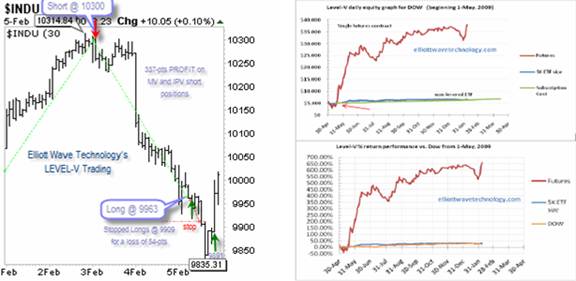
Our last Level-V chart takes us up to date through Friday’s close. In tandem, both of our strategies began to sense a bottom on Friday. So much so, that we booked 337-pts in profits on our shorts from 10300, and started immediately probing the long side of the market for a reversal to the upside.
A tad early, we reversed long @ 9963 with sell-stops to cover at 9909. Well, our forward looking mechanism was a bit more premature than that of the markets and we immediately stopped out of those long positions giving back 54-pts in losses.
The markets forward looking mechanism would not kick in until an additional 74-pts of downside occurred from the point at which we stopped out of our long positions.
From the start of this tactical journey on 28-Jan, through the close of trade on Friday February fifth, it’s safe to say that we and our subscribers cleaned house at Level-V. Our MV traders opened their first position on 28-January at 10111, while IPV members joined the campaign on February 1st at a level of 10149.
All told, our MV traders racked up 384 Dow pts in 5 trades, while our IPV constituents pulled in 434 points of booty in just 3 trades. Now that is not bad for a week’s worth of controlled speculative risk-taking.
So you’re thinking we got lucky with LEVEL-V and simply had ourselves a good week
The red lines on the stacked equity graphs to the right clearly illustrate otherwise.
We have plotted the two equity curves from inception of Level-V accounting, which began nine months ago in March of 2009. Results measure a starting account size of 5K, which has traded one single Dow futures contract per signal at the IPV level.
Though a bit small and perhaps illegible, the upper graph tracks the growth path in account size, which is now well over 35K. The green line way down at the bottom is the cost of subscription access to Level-V trading.
The lower equity graph tracks the same IPV performance, but measures our equity growth in percentage terms from our starting account size of 5K. Current IPV level-V returns are knocking at the door of 700%. The gold colored line toward the bottom of this graph, illustrates the equivalent percentage of growth in the Dow from an equal starting point.
To be sure, we have had considerable drawdowns, which reflect in the equity graphs. Until last week’s killer performance, it appeared that IPV equity was beginning to crash. Much like the markets themselves, suddenly and abruptly, everything changed, and we are now at a fresh all-time-high.
Not the day-trading cowboy type and simply looking for big-picture guidance
We hear you. In fact most are not cut out to trade in such a zone. The TradeZone is much like a war zone - even for long-term investors.
Most are not adequately prepared to handle such battle, and many suffer various types of post traumatic trading disorders following exposure to the type of carnage that can be inflicted upon trading and investment accounts.
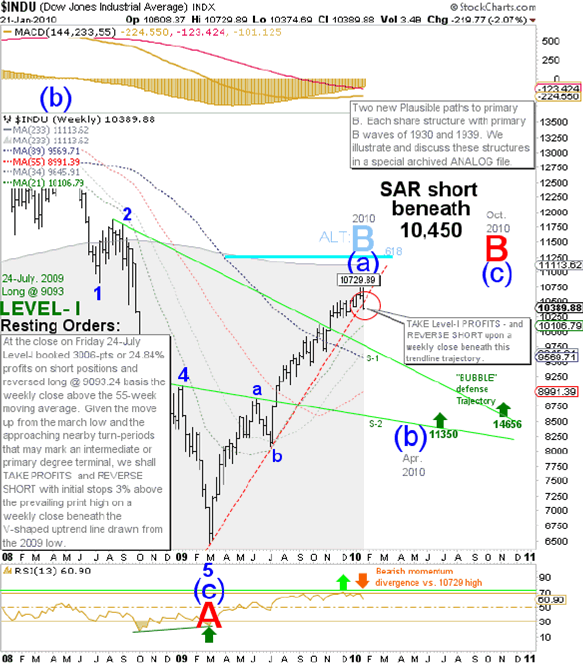
Our PTP (Position Traders Perspective) members get the same caliber of easy-to-follow visual guidance at LEVEL-I as our day-trading warriors get at LEVEL-V. Each chart tells the full story, just like the one below.
Long-Term investor-types have come to love LEVEL-I unconditionally
If you are looking for big-picture guidance to avoid being run over by a freight train, look no further than LEVEL-I guidance from our PTP publication. In addition to saving PTP members from crushing losses in the crash of 2008, we also made them tons of money on the short side amid the catastrophe.
Add to that our all-clear in July ‘09 to cover shorts and reverse long, then sprinkle that with another advance call to take more profits and reverse short a breach of 10450 a week before the 10729 print high, and you end up with a lasting kind of unconditional love from your constituents. It’s that simple.
By Joseph Russo
Chief Publisher and Technical Analyst
Elliott Wave Technology
Email Author
Copyright © 2009 Elliott Wave Technology. All Rights Reserved.
Joseph Russo, presently the Publisher and Chief Market analyst for Elliott Wave Technology, has been studying Elliott Wave Theory, and the Technical Analysis of Financial Markets since 1991 and currently maintains active member status in the "Market Technicians Association." Joe continues to expand his body of knowledge through the MTA's accredited CMT program.
Joseph Russo Archive |
© 2005-2022 http://www.MarketOracle.co.uk - The Market Oracle is a FREE Daily Financial Markets Analysis & Forecasting online publication.