


U.S. Treasury Bonds TLT and IEF Update
Interest-Rates / US Bonds Feb 17, 2010 - 08:52 PM GMTBy: Guy_Lerner

 One month ago, I looked at US Treasury bonds, and I was a bit more constructive than I had been in the prior 12 months. Technically, it had appeared that TLT and IEF had made reversals. So what has happened?
Absolutely nothing! Bonds have yet to get off their back and move higher. On the other hand, they have not moved lower. Do I get any points for that?
The analysis remains sound, and the key pivot points that I identified appear to be providing support as buying seems to surface when TLT or IEF get down to those levels.
For example, figure 1 is a weekly chart of the i-Shares Lehman 20+ Year Treasury Bond Fund (symbol: TLT). The key pivot point at 89.91 remains the line in the sand or key support level, where buying has surfaced. Conversely, a close back below 89.91 is bearish. I would become very constructive on TLT on a weekly close above 92.15, which is the next key pivot point or level of resistance.
Figure 1. TLT/ weekly
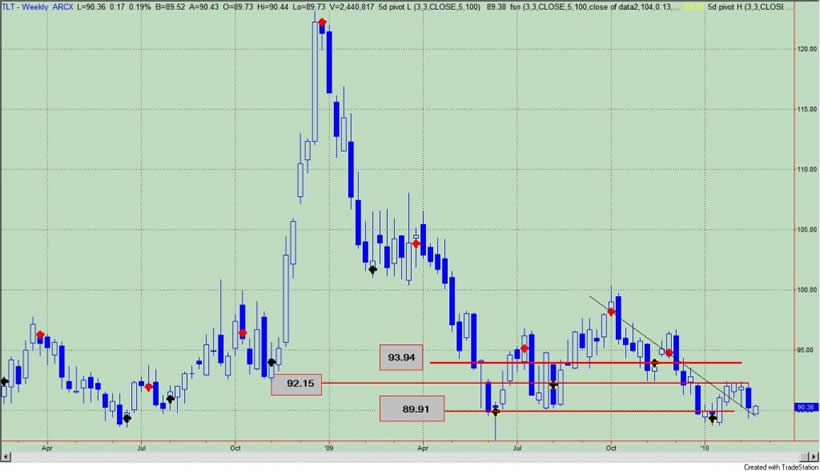
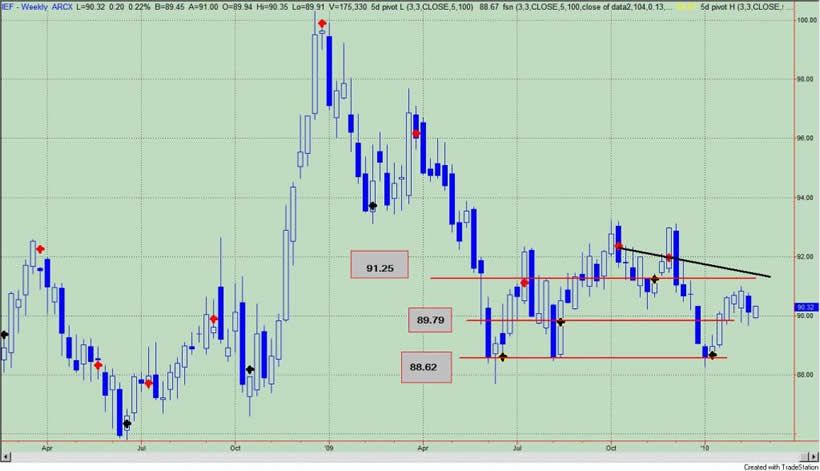
Figure 2 is the the i-Share Lehman 7-10 Year Treasury Bond Fund (symbol: IEF). 89.79 remains the key area of support here; therefore, a weekly close below this level is bearish. A weekly close above the key pivot at 91.25 suggests a run to $94 to $96.
Figure 2. IEF/ weekly
Ok, I know bonds aren't the most exciting, but in this "risk on/ risk off" market environment, I find them to be a good diversifier. But realistically, this position has yet to take off as expected, so in reality it has been dead money. On the other hand, I do find IEF and TLT to be in a good reward to risk position. I like the fact that most investors are betting on higher yields, so this is the opposite of that trade. Furthermore, buying against support is an "ideal" place to buy, and that's what we are doing here.
But maybe what I stated last month still applies as Treasury bonds are not going to attract much interest:
"How am I squaring the long term secular story for higher Treasury yields with the current and more intermediate term rise in Treasury bonds? We have been down this road several times in the past 12 months, and you have had to be very nimble to capture profits when betting on higher bond prices. Maybe this time will be different. Maybe the current reversal will result in a more tradeable rally for Treasury bonds. Regardless, we have our sign posts (i.e., key pivot levels) marked and we will interpret the price action as we go."
By Guy Lerner
http://thetechnicaltakedotcom.blogspot.com/
Guy M. Lerner, MD is the founder of ARL Advisers, LLC and managing partner of ARL Investment Partners, L.P. Dr. Lerner utilizes a research driven approach to determine those factors which lead to sustainable moves in the markets. He has developed many proprietary tools and trading models in his quest to outperform. Over the past four years, Lerner has shared his innovative approach with the readers of RealMoney.com and TheStreet.com as a featured columnist. He has been a regular guest on the Money Man Radio Show, DEX-TV, routinely published in the some of the most widely-read financial publications and has been a marquee speaker at financial seminars around the world.
© 2010 Copyright Guy Lerner - All Rights Reserved
Disclaimer: The above is a matter of opinion provided for general information purposes only and is not intended as investment advice. Information and analysis above are derived from sources and utilising methods believed to be reliable, but we cannot accept responsibility for any losses you may incur as a result of this analysis. Individuals should consult with their personal financial advisors.
Guy Lerner Archive |
© 2005-2022 http://www.MarketOracle.co.uk - The Market Oracle is a FREE Daily Financial Markets Analysis & Forecasting online publication.