


Weekly Gold and Silver Technical Analysis Report - 5h August 2007 - Technically Precious with Merv
Commodities / Gold & Silver Aug 05, 2007 - 05:00 PM GMTBy: Merv_Burak

And away we go. The plunge of the previous week is almost corrected – except for the volume. On the whole, speculators are still leery about this market so the up side is still not a done deal.
GOLD
I find so often that a quick glance at a long term P&F chart quickly tells us where we are in the scheme of things. With the daily ups and down of the gold market one can quite quickly get confused and frustrated wondering where we stand. The chart above tells us we are still in a long term bull market but below previous highs. Although bullish, we are moving laterally within that trend. We have two serious resistance levels to overcome before we can say that we are in a new raging bull market. Those resistance levels are the $690 and $720 levels (keeping in mind that with a $15 unit chart one needs $705 and $735 to breach these levels).
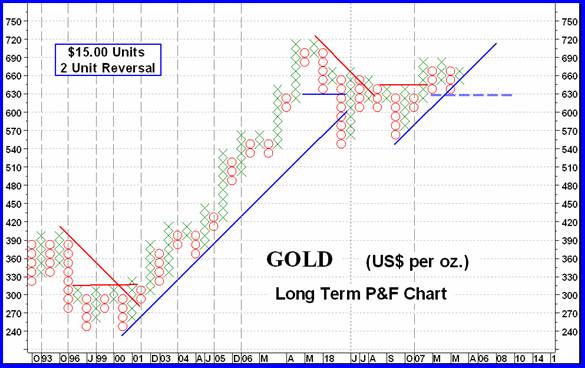
The last quick piece of information is the support at $645 requiring $630 to break below. That would also break the up trend line and define a bear market should it occur. All that information with only a 5 second glance at the P&F chart. Some investors prefer reading volumes of information, going through pages of economic reports, and for what? Would the final outcome be any clearer than the 5 second P&F glance? These charts are based upon the actual trading activity of all market participants, including all those who read reports, etc. Their ACTIONS are what we are looking at. Let someone else do the reading, save time and only glance at the appropriate chart to see what they have determined by studying their actions.
One would use this information towards ones investment strategy, whether to be looking for buy side investments or sell side trades (I am talking long term here, for intermediate or short term action one would likewise use the appropriate time period chart). In the end a shorter term chart would be required before acting as the shorter term may be in a direction different from the long term. If one were interested in stock trading then the stock charts determine your actions.
Looking at a candlestick daily chart with our normal indicators we see the lateral trend continuing. The price continues to move above and below its long term moving average line with the line eventually following. Until such time as either resistance or support is broken on the P&F chart the indicators may provide an advance analysis of trend but is more susceptible to reversals before the P&F breaks. Gold is once more above its long term moving average line and the line is pointing upwards. Long term momentum is still positive but weak. The volume indicator is below its trigger line but moving upwards.
I am moving the long term rating back to the BULLISH side this week (from last week's + Neutral) although I do understand that the chart action still has a little more convincing to do.
INTERMEDIATE TERM
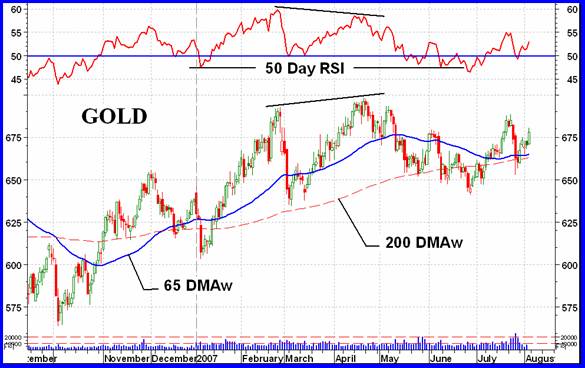
Although things are starting to look better from the intermediate term we still have some proving to do. We are still under the influence of that negative divergence (the April price top versus the lower top on the momentum) and to some extend the lower momentum reading in June versus its reading in Jan. Momentum continues to show weakness and the slight recovery over the past several days has not yet dispelled such weakness. Although Friday's volume action is not known the rally until then has been on very low volume as opposed to the volume generated during the previous day's down side action. This is not an encouraging sign. However, the indicators (price-moving average and momentum) are in their positive zones so one should be encouraged at least to some minor extent. I will keep my NEUTRAL intermediate term rating for another week, waiting for some stronger indication of trend.
SHORT TERM
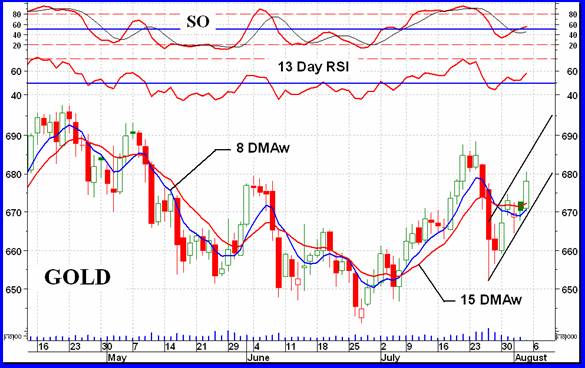
The past week was a good week for gold, although not so good for stocks. We have had a few weeks in the past where we had a few good upside days but with little speculative volume. These have all ended with continuing downside action. From the recent action I strongly suspect the same to happen here. Unless the volume perks up, and it might have on Friday, it will be difficult for gold to breach mid-July highs. At the present time the up move seems to be based more upon lack of sellers than an abundance of buyers. The rally, however, has turned the short term moving average up and the momentum, although weak, has climbed into its positive zone so for the coming several days one might continue with the existing bullish trend. A move below $665 should reverse the trend however.
IMMEDIATE TERM
Well, I got the bounce right last week although I didn't expect the move to turn the very short term moving average around, which it did on Friday. Now where? Continuation of the trend is by far the best bet, at least in the next couple of days. However, I don't expect the price to exceed the mid-July highs unless the volume perks up a lot from here. A close below $670 would reverse the trend.
NORTH AMERICAN GOLD INDICES
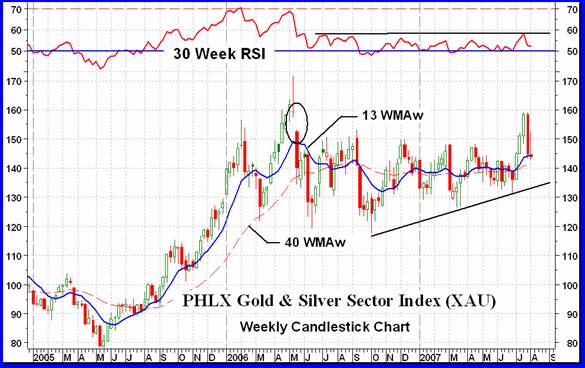
Well, here we are to the most popular North American Gold Index, the PHLX Gold & Silver Sector Index ( XAU ). As with most majors the XAU made a swift dash only to come dumbing down a week ago. This week was a much smaller loss. The chart shows the lateral trend over the past year with the break-out a week ago. Unfortunately, the momentum indicator did not confirm the break which remained suspect, only to be dashed this week. The weakness in the momentum indicator has been noted on many occasions. What we see here is the indicator hugging its neutral line (and going negative slightly) when the Index is near low points ready for rallies. However, this time the momentum is again nearing its neutral line but the Index is near the upper levels of its previous activity. Should the Index now move towards its previous support levels the momentum would most surely go negative. The move a few weeks back started to look good, now to see if that move can pick up steam again or if that was it. One notices the “gap” in the trading data in May of 2006. Technically, these gaps are most often closed by subsequent price moves. That gap was finally closed two weeks ago and then the Index turned. Just an observation.
MERV'S PRECIOUS METALS INDICES
The overall Composite Index of Precious metals Indices stayed steady during the week and showed a loss of less than 0.2%. This was primarily due to the positive week that the gold and silver bullion had, along with the FTSE Indices. The other component Indices had losses of less than 1.0%, give or take a few fractions. We have had sharp declines in this Index several times in the past. There is no real rhyme or reason for what follows. Most of the time the Index would halt, take a breather and then rally. Sometimes it would just continue lower. We'll just have to wait to see what follows this time. One thing that needs to change before we can get too bullish on the recent move through resistance is for the momentum indicator to improve. It had not confirmed the Index resistance break and needs to. For now we should still think of the overall precious metals market as remaining neutral.
MERV'S GOLD & SILVER 160 INDEX
So, what's REALLY happening in the precious metals stocks, you should ask? Overall the universe of 160 declined by 1.3% during the week. The Qual stocks had the better week with an advance of 0.0% (you need to go further past the first decimal to see the positive value). The GAMB variety of stocks had the worst week with a loss of 2.0%. So, once more the gambling variety took the hit. As mentioned in the past, the gambling stocks did the best recently so they are bound to react the worst. It goes without saying that there were more declining stocks during the week than advancing stocks. The decliners stood at 92 (58%) while the advancers stood at 57 (36%). Put another way there were 61% more decliners than advancers. As could also be expected, the summation of individual stock ratings showed a decided move towards the negative. All time periods are in the BEAR camp with the short term at 66%, the intermediate term at 51% and the long term at 58%.
As for the charts and indicators, the Index moved below its intermediate and long term moving averages the previous week and remains there this week. The intermediate term average is sloping slightly negative while the long term can be said to be in a lateral direction. The long term momentum indicator is still above its neutral line (as it's been since July of 2005) while the intermediate term momentum continues just below the line.
For this week I have no choice but to go BEARISH on the intermediate term but will remain with last week's NEUTRAL rating for the long term.
MERV'S QUAL-GOLD INDEX : MERV'S SPEC-GOLD INDEX : MERV'S GAMB-GOLD INDEX
As mentioned above the Qual-Gold Index ended the week with a 0.0% gain while the Gamb-Gold Index lost 2.0%. The Spec-Gold Index actually gained 0.3%, small but a gain in any event. With the small moves this past week nothing much has actually changed in the Indices, so I'll just leave it till next week when we might have more to talk about.
SILVER
Silver moved higher during the week and although it may not look like it on a chart it did have a better week than gold. However, it still does not seem to have the strength behind the move for it to have any longevity. I would not be surprised that within the next few days silver will turn around and head towards new lows.
MERV'S QUAL-SILVER INDEX : MERV'S SPEC-SILVER INDEX
Although silver had a good performance during the week one would not know it from the actions of the stocks. The silver stocks took the worst drubbing of the precious metals. The Qual-Silver lost 2.3% while the Spec-Silver lost 1.6% on the week. The Indices are not far from moving below their May-June support levels so let's wait another week or two and see if the support levels hold. From the weakness in the momentum indicators I would guess that the levels will not hold but let's wait.
Merv's Precious Metals Indices Table
Well, that's it for this week.
By Merv Burak, CMT
Hudson Aero/Systems Inc.
Technical Information Group
for Merv's Precious Metals Central
Web: www.themarkettraders.com
e-mail: merv@themarkettraders.com
During the day Merv practices his engineering profession as a Consulting Aerospace Engineer. Once the sun goes down and night descends upon the earth Merv dons his other hat as a Chartered Market Technician ( CMT ) and tries to decipher what's going on in the securities markets. As an underground surveyor in the gold mines of Canada 's Northwest Territories in his youth, Merv has a soft spot for the gold industry and has developed several Gold Indices reflecting different aspects of the industry. As a basically lazy individual Merv's driving focus is to KEEP IT SIMPLE .
To find out more about Merv's various Gold Indices and component stocks, please visit www.themarkettraders.com and click on Merv's Precious Metals Central . There you will find samples of the Indices and their component stocks plus other publications of interest to gold investors. While at the themarkettraders.com web site please take the time to check out the Energy Central site and the various Merv's Energy Tables for the most comprehensive survey of energy stocks on the internet. Before you invest, Always check your market timing with a Qualified Professional Market Technician
Merv Burak Archive |
© 2005-2022 http://www.MarketOracle.co.uk - The Market Oracle is a FREE Daily Financial Markets Analysis & Forecasting online publication.