


US Economic Growth in Domestic Private Final Demand : Its Falling - Can It Get Up?
Economics / US Economy Aug 08, 2007 - 12:06 AM GMTBy: Paul_L_Kasriel

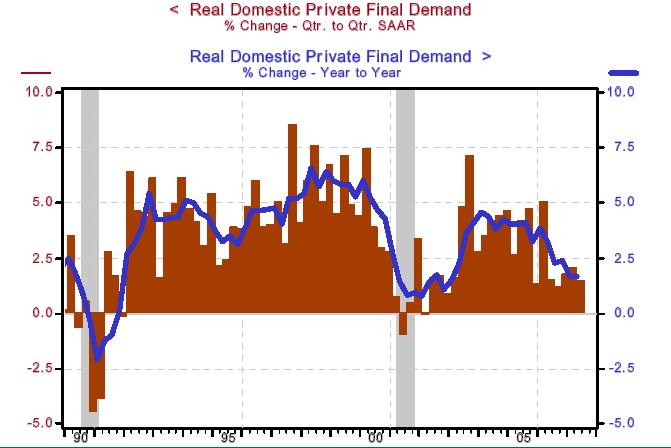
If the housing recession is not spreading to other parts of the economy, how do you account for the fact that growth in real domestic private final demand is slowing? Real domestic private final demand includes the following line items from the gross domestic product (GDP) accounts: personal consumption expenditures, nonresidential fixed investment expenditures and residential investment expenditures. Real domestic private final demand represented about 87% of real GDP in the past five years. Chart 1 shows the growth in real domestic private final demand in recent years – on both a quarter-to-quarter annualized basis and year-over-year basis.
According to the advance estimate of second quarter 2007 real GDP, real domestic private final demand grew an annualized 1.5% vs. the first quarter 2007 and 1.7% vs. the second quarter 2006. On a year-over-year basis, this is the weakest growth since first quarter 2003. We are not forecasting any re-acceleration in the growth of domestic private final demand in the foreseeable future.
Moreover, we believe it is unlikely that the residual 13% of real GDP – government expenditures, exports and inventories – will grow fast enough to re-accelerate real GDP growth on a sustained basis to anywhere near 2.75%, which is in the neighborhood of potential real GDP growth. Assuming real domestic private final demand were to grow over the next year at 1.7%, its second-quarter year-over-year growth rate, then the sum of the residual elements of GDP would have to grow at 10.3% in order to achieve 2.75% growth in overall real GDP. Only once in the past 25 years – first quarter 1984 – has the sum of these residual components grown on a year-over-year basis equal to or above 10.3%. The 25-year compound annual rate of growth in the sum of these residual components in the past 25 years has been only 3.5%.
Chart 1
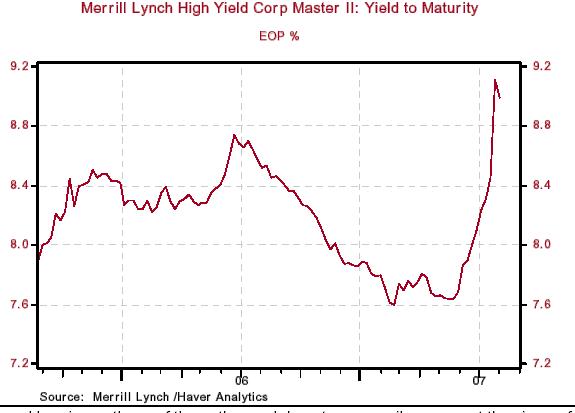
As we have discussed elsewhere (see Wealth Effect or Borrowing/Asset Sales Effect? ), households have been engaged in deficit spending since 1999. They have been funding these deficits by borrowing, primarily in the mortgage market, and by selling assets to non-household entities, primarily corporate equities, back to their corporate issuers and to private equity syndicates. With house prices now falling and with mortgage lenders tightening their underwriting standards, the mortgage-borrowing tributary of deficit funding is drying up (see Chart 2). Corporate stock buybacks and private equity buyouts might not flow as rapidly going forward inasmuch as the bond market funding of these activities is getting more expensive, as evidenced by the 136-basis-point increase in high-yield (junk) bond yields from May 25 to August 3 (see Chart 3). With these funding sources of household deficits less abundant, it is no wonder that growth in personal consumption and residential investment expenditures has slowed.
Chart 2
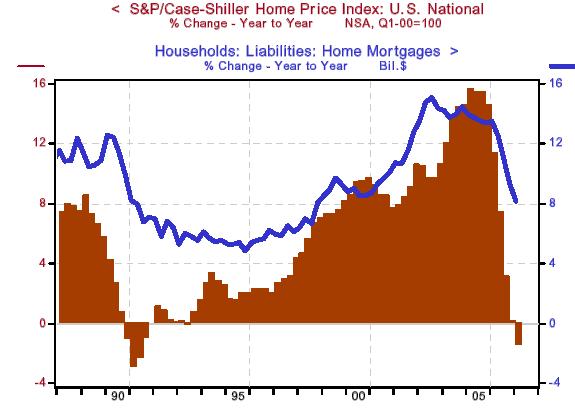
Chart 3
The tentacles of the housing recession are reaching beyond consumer spending. Freight haulers, both truck and rail, are reporting weaker volume growth because of the decline in residential construction activity. With fewer new housing developments popping up in suburbia, newspaper advertising revenues are being adversely affected. And the producers of construction equipment, such as Caterpillar, are experiencing softer domestic sales.
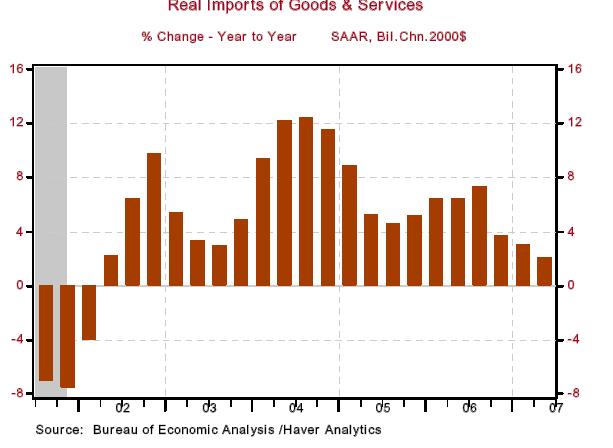
Although exports are likely to be the star performing sector of the U.S. economy in coming quarters, there even is downside risk here, too. First, a lot of the strength in foreign economies in recent years stemmed from America's seemingly insatiable demand for their products. But, as Chart 4 shows, growth in U.S. demand for foreign goods and services has slowed. In fact, on a quarter-to-quarter basis, U.S. imports contracted at a 2.6% annual rate in the second quarter 2007. So, the slowdown in U.S. import demand will negatively affect economies in the rest of the world. Second, foreign central banks are still in a rate-increasing mode. With a lag, these interest rate increases will dampen domestic demand in foreign economies.
Chart 4
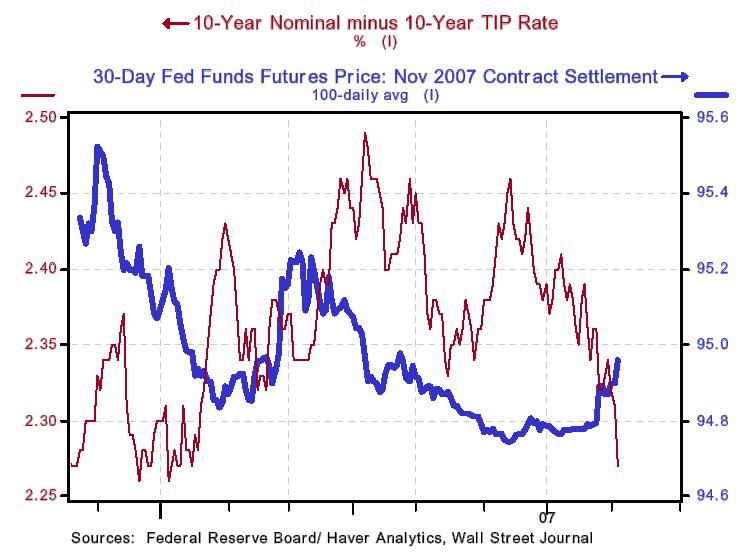
The recent flare-up of energy prices has resulted in a re-acceleration in general consumer price indexes. At the same time, a market-based indicator of inflation expectations – the difference between the yield on a regular 10-year Treasury security and the yield on an inflation-protected 10-year security – has actually been signaling lower inflation expectations (see Chart 5). It is noteworthy that the lower market-based inflation expectations are not because the markets expect the Federal Reserve to raise interest rates to combat the current re-acceleration in goods/services price increases. Rather, as also shown in Chart 5, traders in the federal funds futures market are beginning to price in a cut in the funds rate, as evidenced by the rise in the price (which moves inversely with the level of the interest rate) of the November 2007 federal funds contract.
Chart 5
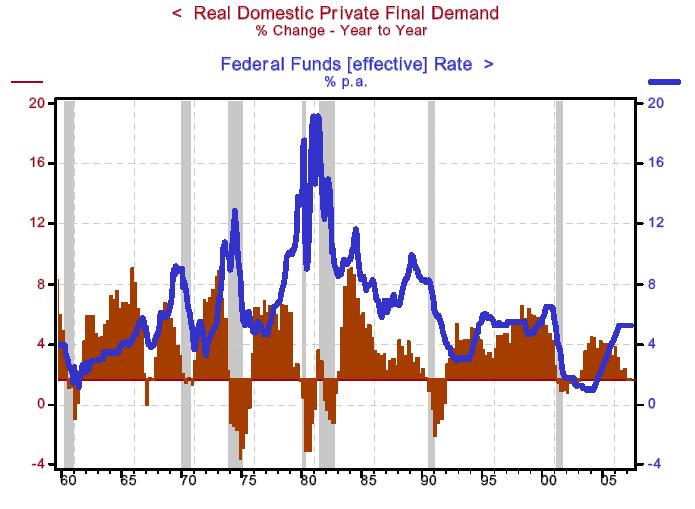
As we stated at the outset, year-over-year growth in real domestic final demand has fallen to 1.7% in the second quarter 2007. As Chart 6 shows, whenever growth in the aggregate has fallen to the current rate, it has never “gotten up” without some help from the Federal Reserve in the form of cuts in the federal funds rate. Indeed, more often than not, even with the help of the Federal Reserve, growth in this aggregate has not gotten up until after the economy had entered a recession (indicated by the shaded areas in Chart 6). Perhaps the Federal Reserve this time will not hear the plaintive cry of real domestic private final demand: “My growth has fallen and it can't get up.” But we think the Federal Reserve will come to the aid of real domestic private final demand at the October 30-31 Federal Open Market Committee meeting by cutting the federal funds rate by 25 basis points. As a point of information, the Commerce Department will release its first estimate of third-quarter real GDP growth. Our current estimate of this growth quarter-to-quarter annualized is only 1.5%, with real domestic private demand growing a touch less at 1.4%.
Chart 6
*Paul Kasriel is the recipient of the 2006 Lawrence R. Klein Award for Blue Chip Forecasting Accuracy
THE NORTHERN TRUST COMPANY
ECONOMIC RESEARCH DEPARTMENT
August 2007
SELECTED BUSINESS INDICATORS
Table 1 US GDP, Inflation, and Unemployment Rate
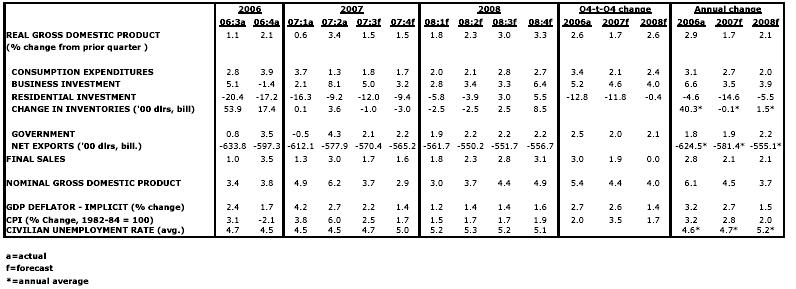
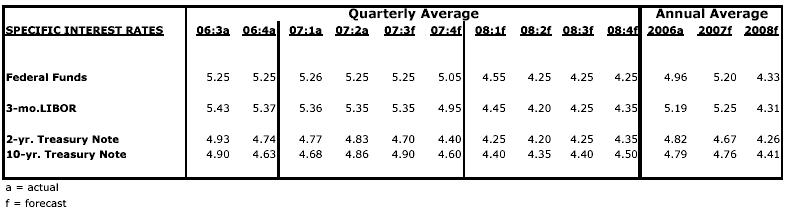
Table 2 Outlook for Interest Rates
By Paul L. Kasriel
The Northern Trust Company
Economic Research Department - Daily Global Commentary
Copyright © 2007 Paul Kasriel
Paul joined the economic research unit of The Northern Trust Company in 1986 as Vice President and Economist, being named Senior Vice President and Director of Economic Research in 2000. His economic and interest rate forecasts are used both internally and by clients. The accuracy of the Economic Research Department's forecasts has consistently been highly-ranked in the Blue Chip survey of about 50 forecasters over the years. To that point, Paul received the prestigious 2006 Lawrence R. Klein Award for having the most accurate economic forecast among the Blue Chip survey participants for the years 2002 through 2005.
The opinions expressed herein are those of the author and do not necessarily represent the views of The Northern Trust Company. The Northern Trust Company does not warrant the accuracy or completeness of information contained herein, such information is subject to change and is not intended to influence your investment decisions.
Paul L. Kasriel Archive |
© 2005-2022 http://www.MarketOracle.co.uk - The Market Oracle is a FREE Daily Financial Markets Analysis & Forecasting online publication.