


Panic Selling As Stock Markets Crash Towards Bull Market Support Levels
Stock-Markets / Financial Crash Aug 16, 2007 - 01:50 PM GMTBy: Marty_Chenard

Noon Time Update: We will look at seven charts this Noon time, based on where a number of indexes were at the close yesterday and what the VIX was telling us (last chart).
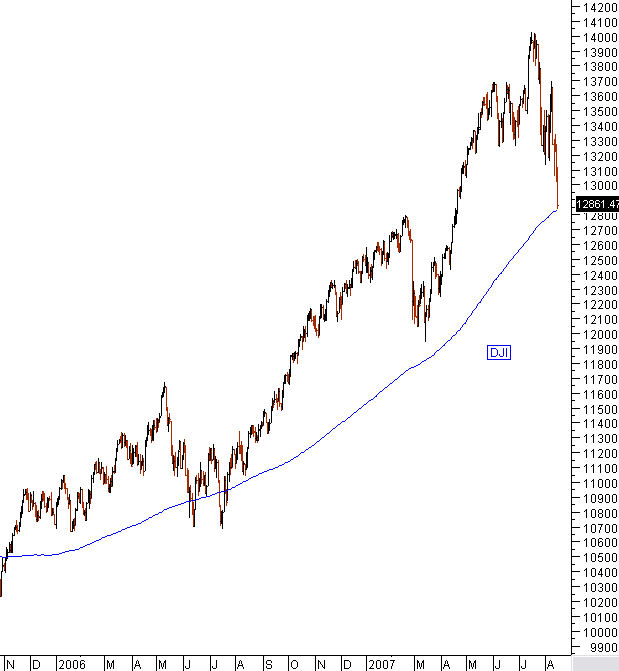
This first chart is of the DJI and its 200 day moving average. At the close yesterday, it was holding above it, but today it dropped below that support. The DJI is the index that should be the strongest in this down turn, but this morning it dropped below the 200 day moving average. Panic selling levels are high now, and the panic has its own momentum. It will be important to hold the 200 day moving average in the next few days.
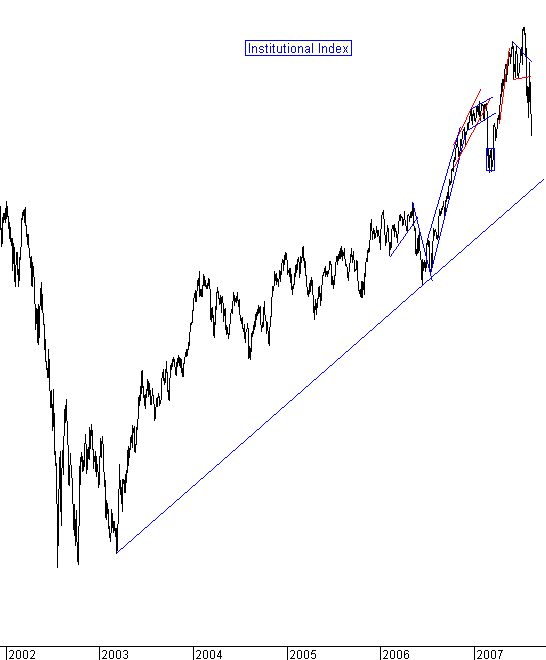
This is our Institutional Index of "core holdings" held by Institutions.
The bad news is that it is dropping and has a ways remaining to reach a support level. The good news is, that its bull market support is still in place as long as it stays above the support line.
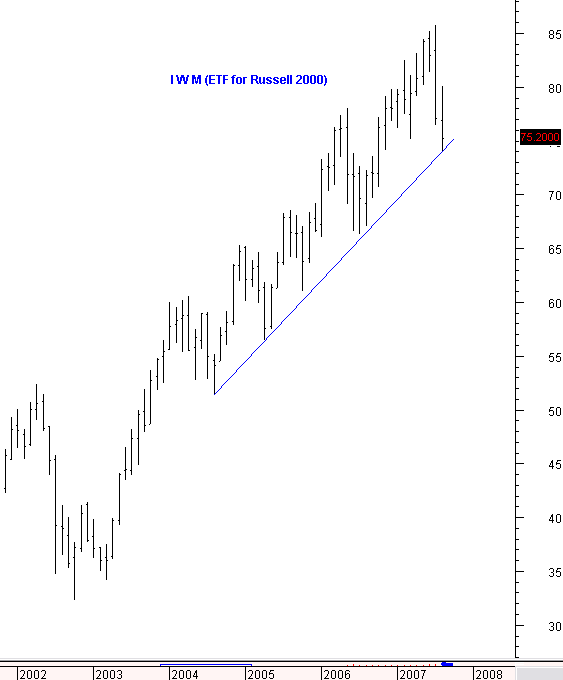
This is the IWM ... the ETF for the Russell 2000 on a monthly chart basis. It is also is still holding its bull market support line. So, as bad as this down turn is to those who never saw the light and never went to cash ... the bull market support on the IWM is still in place.
What's the danger here if we don't hold support? A very serious drop, that will put us in a recession and a bear market.
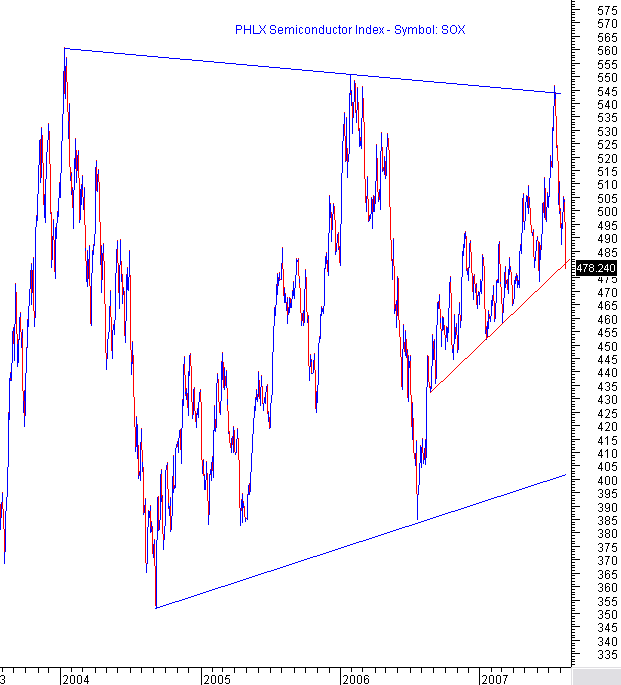
This is the Semiconductor index
Note that it just broke a support line within its very large trading range. The downside here, is that it could move down to the 400 support area if it doesn't move back up above support fairly soon.
On the plus side, it has been down to its lower support twice since 2004 and that should be a holding point if it goes that far. The problem on the SOX, is that it has a long ways to fall if it really breaks down further.
This is the SPY on a monthly chart.
Clearly, it has broken support to the downside ... see the next chart ...
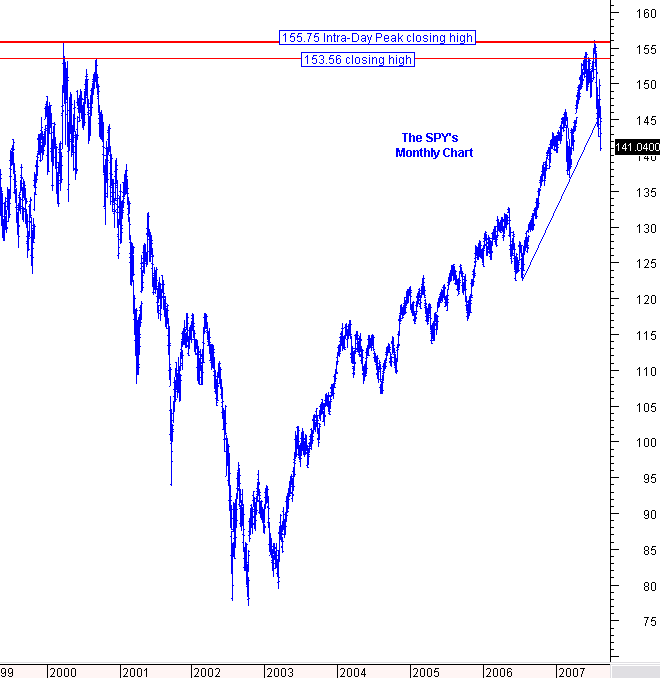
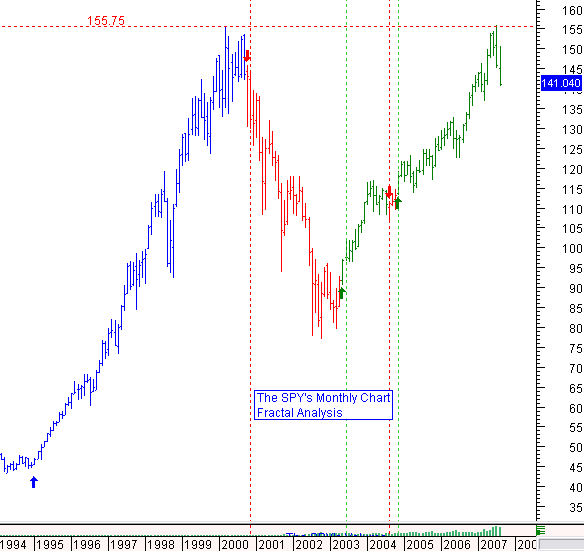
This is the SPY's monthly chart with a Fractal Analysis study.
The 1994 to 2000 move was an uninterrupted Fractal move up. When in a signal down condition (see the red bars), it signaled a bear market that didn't end until the green bars fractal showed an up move.
Right now, we are still green for a Fractal up condition, but we are entering a danger zone where we are getting very close to a Fractal down condition. See the last chart below ...
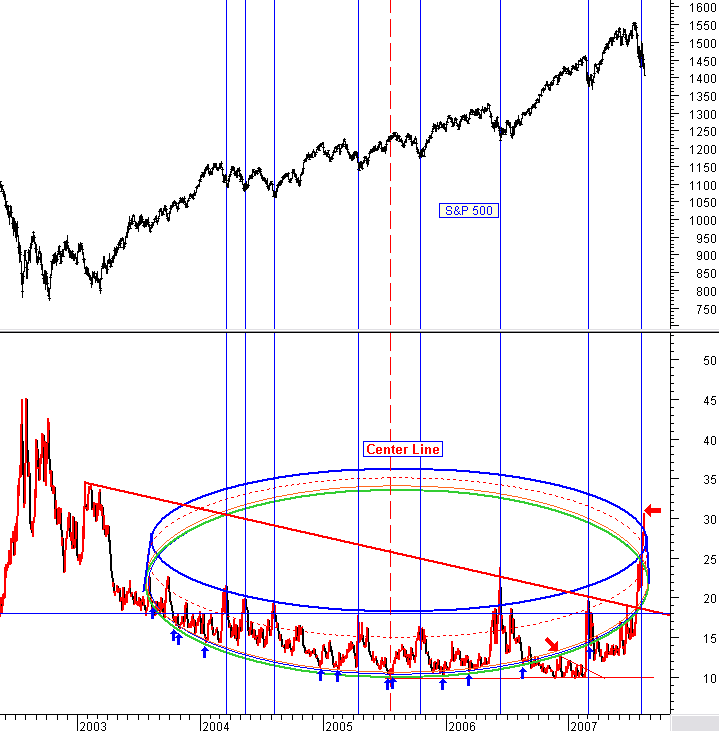
This is a VIX (Volatility Index) concentric circle study I did a few years ago. Many of you have seen this concentric circle analysis before.
For two years, mid 2003 to mid 2005, the VIX exactly held to this concentric circles support and resistance levels. In Mid 2005, we had hit the center of the circle and we where then in a position to ride the upside of the circle. In mid 2006, a deviation occurred and we broke through the circle's bottom support for the first time and we saw a large rally to the upside. The two market drops in 2007 both happened when the VIX rose and re-entered the concentric circle.
What is happening now, is a huge rise, that is taking the VIX above the highest resistance point of the concentric circle. The timing is almost right, as the circle is coming to an end. I drew this concentric circle over 2 years ago. This is suggesting that we are going to move into a market that has greater instability over the coming months. We are likely to see capitulation down moves, followed by fairly quick, sharp market rallies to the upside.
This down move is largely built on the pre-expectation of more hedge funds going belly-up, and more sub-prime funds closing off any redemptions to investors. So, a lot of that news hasn't come out yet, yet it is already being factored into the market. When that news does come out ... if it is not as bad as expected, then the market will go rushing to the upside, but that news is probably still at least two to three weeks away.
If the news comes out and it turns out to be worse than imagined, then we will be moving down for quite some time and will very likely see a recession. People are afraid of what they can't see ... and no one can see how bad or good the sub-prime and fund valuation problem is just yet ... so people are imagining the worse. They may be right, and they may be wrong. I don't think the nervousness will be resolved until regulators give us a clear picture of what is going on.
Posted earlier this Morning:
The VIX (Volatility Index) is now showing "fear" levels consistent with panic selling.
Fear that a large number of Hedge Funds will fold, fear that sub-prime mortgage fund value disclosures at the end of August will be ugly, and fear that a credit crunch will send us into a recession. Talk to pit traders and you will hear them say that the worries are all about "something going on that we can't see".
So right, or wrong, the fears are based on some serious unknown, really bad news that has not been disclosed yet. Some investors are now starting to worry about a financial banking crisis. I will call Veribanc today and get a picture of how the banks are looking. Veribanc has been rating and analyzing the banking industry over 26 years, and they are regarded as one of the industry experts in this area. (I will report on this tomorrow for our Standard and Advanced subscribers.)
What these have in common, is that they are all fears about future events, so some of the worse expectations are already being factored into the market before they happen. If they happen, a good part of the market adjustment will have already been factored in ... unless we go into a bear market, then things will continue to get worse. If they don't happen, then the negative over-reaction will send a slew of buyers picking up bargains. For now, fear levels still show no signs of subsiding, and an extreme capitulation level is likely to be reached in the markets.
Some long term indexes lost support yesterday, and some didn't. I will do an extensive update on this at Noon time today and post it on this page ... so please return then.
By Marty Chenard
http://www.stocktiming.com/
Please Note: We do not issue Buy or Sell timing recommendations on these Free daily update pages . I hope you understand, that in fairness, our Buy/Sell recommendations and advanced market Models are only available to our paid subscribers on a password required basis. Membership information
Marty Chenard is the Author and Teacher of two Seminar Courses on "Advanced Technical Analysis Investing", Mr. Chenard has been investing for over 30 years. In 2001 when the NASDAQ dropped 24.5%, his personal investment performance for the year was a gain of 57.428%. He is an Advanced Stock Market Technical Analyst that has developed his own proprietary analytical tools. As a result, he was out of the market two weeks before the 1987 Crash in the most recent Bear Market he faxed his Members in March 2000 telling them all to SELL. He is an advanced technical analyst and not an investment advisor, nor a securities broker.
Marty Chenard Archive |
© 2005-2022 http://www.MarketOracle.co.uk - The Market Oracle is a FREE Daily Financial Markets Analysis & Forecasting online publication.