


Stock Market Investor Sentiment: It Would Be Better If...
Stock-Markets / Stock Markets 2010 May 23, 2010 - 04:28 AM GMTBy: Guy_Lerner

 It would be better if prices on all of the major indices: 1) decisively broke their 200 day moving averages; 2) closed below weekly support levels; and 3) closed below the February, 2010 lows. It would be better if the prior week's pullback, which morphed into this week's "correction", actually caused investors to utter the "b" word -- as in bear market. It would be better if investors had their spirit's broken as investor sentiment actually turned bearish (i.e., bull signal).
But none of this happened, and what seemed scary last week really wasn't enough in my opinion to produce a lasting and meaningful bottom. So if prices go higher from here, we will have the same old story of a market:
1) that went down for a week or two;
2) that got everyone worried ~ “oh my god, a 10% correction” from ridiculously overbought levels I might add;
3) that will be bid back up rather strongly;
4) that will make investors forget about the prior week;
5) that will be sold rather abruptly again.
This kind of price action, I am convinced, is consistent with distribution and a market top. The best market bottoms occur when investors turn bearish, and this has yet to happen.
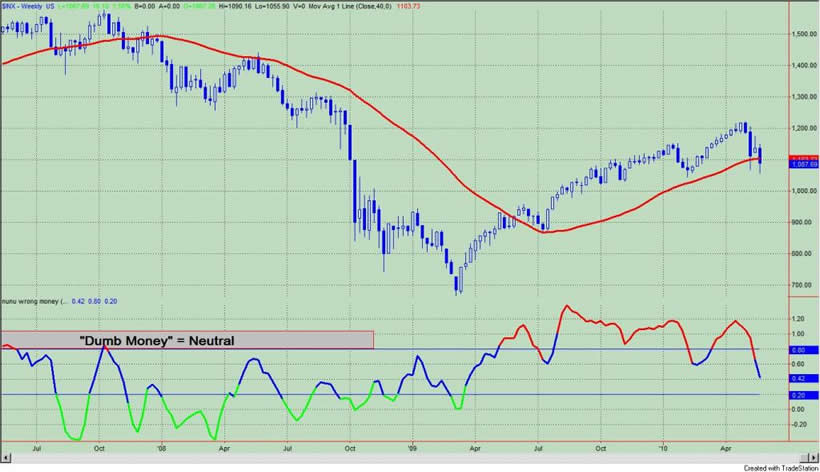
The "Dumb Money" indicator (see figure 1) looks for extremes in the data from 4 different groups of investors who historically have been wrong on the market: 1) Investor Intelligence; 2) Market Vane; 3) American Association of Individual Investors; and 4) the put call ratio. The "Dumb Money" indicator is neutral.
Figure 1. "Dumb Money" Indicator/ weekly
The "Smart Money" indicator is shown in figure 2. The "smart money indicator is a composite of the following data: 1) public to specialist short ratio; 2) specialist short to total short ratio; 3) SP100 option traders. The "Smart Money" indicator is neutral.
Figure 2. "Smart Money" Indicator/ weekly
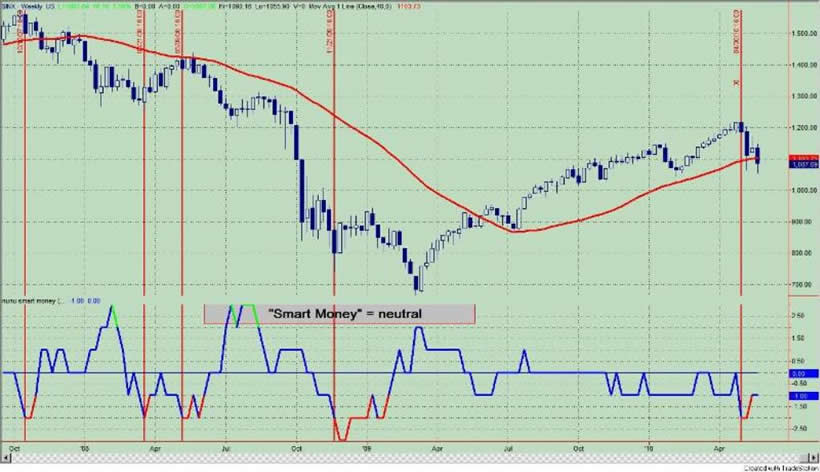
Figure 3 is a weekly chart of the S&P500 with the InsiderScore "entire market" value in the lower panel. From the InsiderScore weekly report we get the following: "..
selling intensified in almost every sector and industry. If there's a silver lining it's that we did see a number of actionable buys last week. Of course, they were outnumbered by the actionable sells and only the Basic Materials was able to squeeze out anything resembling positive sentiment."
Figure 3. InsiderScore/ weekly "entire market" value
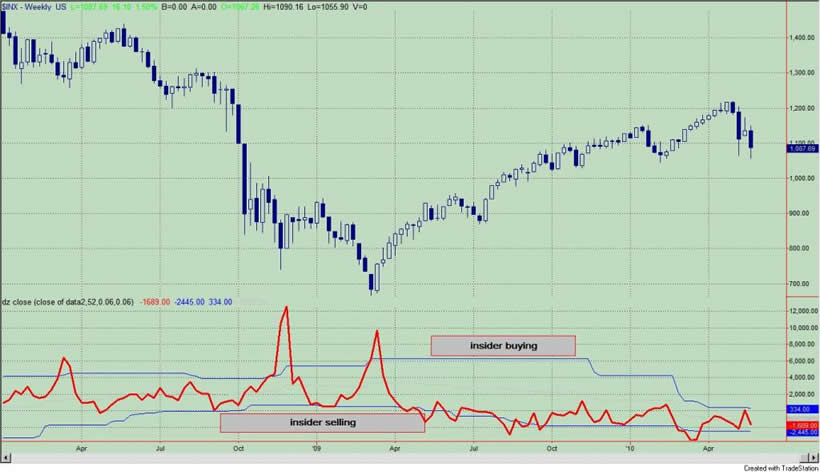
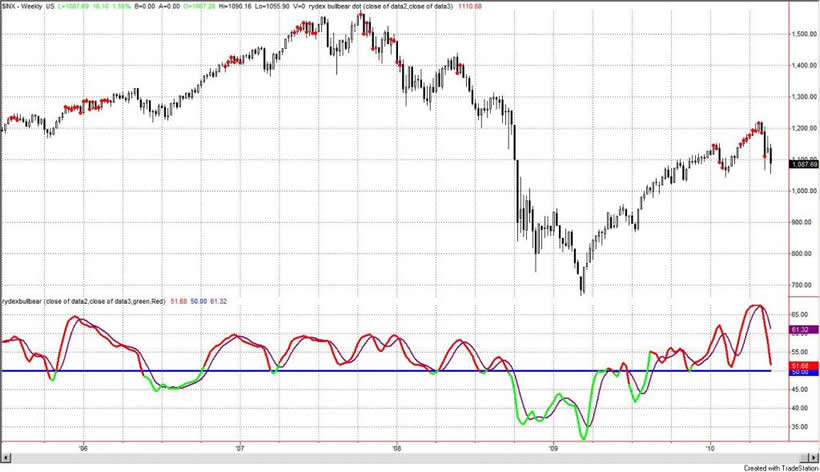
Figure 4 is a weekly chart of the S&P500. The indicator in the lower panel measures all the assets in the Rydex bullish oriented equity funds divided by the sum of assets in the bullish oriented equity funds plus the assets in the bearish oriented equity funds. When the indicator is green, the value is low and there is fear in the market; this is where market bottoms are forged. When the indicator is red, there is complacency in the market. There are too many bulls and this is when market advances stall.
Currently, the value of the indicator is 51.68%. Values less than 50% are associated with market bottoms.
Figure 4. Rydex Total Bull v. Total Bear/ weekly
Improve your market timing. TheTechnicalTake now offers Premium Content on a daily basis for a nominal yearly fee. This unique data set will show you which way investors (i.e., bull market geniuses) are leaning. It is independent and original market analysis. To view a recent report click: REPORT.
To subscribe, please click: SUBSCRIBE
By Guy Lerner
http://thetechnicaltakedotcom.blogspot.com/
Guy M. Lerner, MD is the founder of ARL Advisers, LLC and managing partner of ARL Investment Partners, L.P. Dr. Lerner utilizes a research driven approach to determine those factors which lead to sustainable moves in the markets. He has developed many proprietary tools and trading models in his quest to outperform. Over the past four years, Lerner has shared his innovative approach with the readers of RealMoney.com and TheStreet.com as a featured columnist. He has been a regular guest on the Money Man Radio Show, DEX-TV, routinely published in the some of the most widely-read financial publications and has been a marquee speaker at financial seminars around the world.
© 2010 Copyright Guy Lerner - All Rights Reserved
Disclaimer: The above is a matter of opinion provided for general information purposes only and is not intended as investment advice. Information and analysis above are derived from sources and utilising methods believed to be reliable, but we cannot accept responsibility for any losses you may incur as a result of this analysis. Individuals should consult with their personal financial advisors.
Guy Lerner Archive |
© 2005-2022 http://www.MarketOracle.co.uk - The Market Oracle is a FREE Daily Financial Markets Analysis & Forecasting online publication.