


A Perfect Financial Storm for Gold - Technically Precious with Merv
Commodities / Gold & Silver Sep 09, 2007 - 06:21 PM GMTBy: Merv_Burak

 Global markets weakening, U.S. dollar weakening, gold zooming higher – is this what is sometimes called a “perfect storm” for gold?
Global Markets and the Price of Gold
Last week I deviated from my normal commentary and looked in on the global equity markets. The question not asked at that time was “If the global markets are all weakening how does that affect the price of gold?” It is often inferred that gold price moves counter to the direction of the equity markets.
This is often true BUT NOT ALWAYS. One should not automatically assume that just because the equity markets turn down that gold will turn up. When the markets weaken professionals need to do something with there capital. They can buy gold for “safety” or they can invest in “secure” large well managed companies or they can invest in bonds, etc. Gold is just one of the options. Ensure the charts are in your direction BEFORE risking your capital, regardless of what the investment may be.
Gold Indices and Exchange Traded Funds (ETF)
I'm in the process of upgrading the component stocks in my various Precious Metals Indices. One thing caught my eye that I had not previously thought about. In my universe of 160 stocks I try to include at least the top 100 precious metal stocks traded on the North American markets, based upon market value at the time of upgrade. Within this list of 100 are several stocks whose assets are primarily gold bullion, silver bullion or stocks of precious metals companies (ETF's). None of these are represented anywhere within the major North American Gold Indices. Even StreetTracks Gold Trust with a market value in excess of $10 Billion and daily trading volume in the millions (15 million on Friday) is nowhere represented. Yet these are valid precious metal stock investments for a large group of investors and are significantly larger than many stocks that are in these Indices.
Why are they not included? A puzzle.
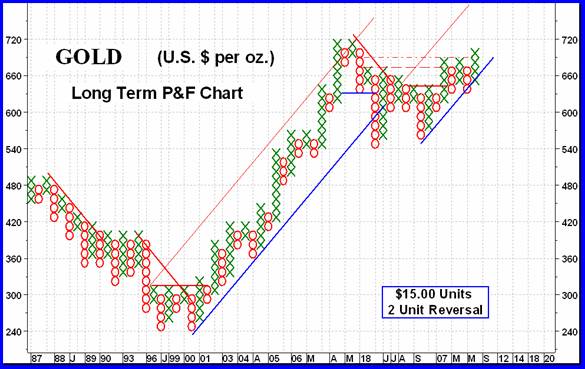
GOLD : LONG TERM
The move that started a week ago Friday just kept on moving. From the price and momentum standpoint things may look great but there still is some concern, which I will get into in the more aggressive time periods later in the commentary. For now let's see how this action has changed, or not, the long term prognosis.
Looking in on the long term P&F chart (see next page), as we do when there is something new to look at, we see that the chart has now broken above its latest congestion area and now focused at the previous highs at $720. It will require $735 to break into new bull market highs. With this latest move we can now calculate a third projected level to keep in mind as the trend continues. The first projection was the $780 level. As the new move continued we had a second upside break projecting to the $915 level. Now, with the latest move above the recent congestion area we can project a third level, to $1035. AH, fun and games with numbers. Will all of these projections be met? Well, usually the first one is met but the later ones become harder and harder. Sometimes these projections seem like pipe dreams but are met. At other times they look like a sure bet but do not get met. That is why they are called projections, with the inference that they are basically a guide and not something you place 100% certainty on.
It goes without saying that the long term P&F chart remains BULLISH.
As for the normal indicators gold is well above its positive sloping long term moving average line and the momentum indicator is moving sharply higher although still a little weaker than the price. The price has moved above its previous April high but the momentum is still below its high. Volume is still a concern as it is a lot lower than one would like to see during a bull run. It is starting to perk up but could stand much more activity on the up side to make a strong move.
All in all the long term remains BULLISH.
INTERMEDIATE TERM
The intermediate term P&F has broken on the up side and at present is projecting to the $840 level, as a start. That is at the all time high price level that gold reached during the previous 1980 bull market top. The chart suggests a rest period very soon but it should not amount to much. Rest or no rest, the intermediate term P&F is now BULLISH.
The recent action took the price of gold right up to the upper channel trend line shown in the commentary two weeks ago. It just breached the trend line but closed just below it. The next move should decisively breach the line or cause a reaction lower. At the Friday's close gold is now poised to breach its next resistance level, the May 2006 highs, and go into new bull market highs.
With the action this past week the intermediate term moving average line is starting to turn more aggressively upward. Momentum has also moved sharply higher but is still below the previous high levels from Feb and April. Gold has moved above its previous highs. The volume action is sadly lacking. It is presently in a lateral trend while price and momentum are roaring upwards. Lack of speculative and professional interest suggests that maybe there is not much more upside left to the move, but let's wait for it to turn before acting. Sometimes the professionals come after the trend has been established.
On the intermediate term I have upgraded my rating to the BULLISH camp.
SHORT TERM
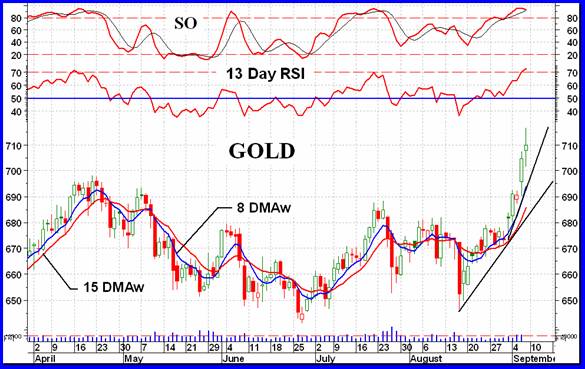
A terrific move this past week but can it last? Unfortunately, the short term momentum indicator (13 Day RSI) is at a level from which previous rallies ended. It may still go higher but the odds are for a retrenchment from these levels. Still one would not go against an established trend until the trend actually reversed. So, with a positive moving average and momentum readings I will continue with a positive continuation of the move, over the next several days.
IMMEDIATE TERM
With the Stochastic Oscillator topping out and just about to cross below its trigger line one would be very leery about gambling on the up side over the next few days. However, my criteria is to remain positive until the trend has actually turned, and that may not be in the next day or two. Should the SO cross its overbought line to the down side THAT might be a good time to consider the reverse direction.
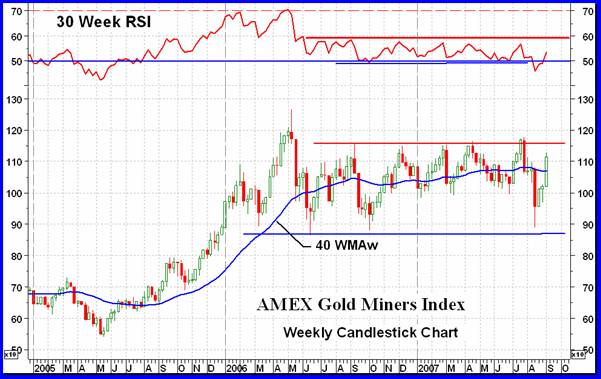
NORTH AMERICAN GOLD INDICES
This week's major Index is the AMEX Gold Miners Index. An Exchange Traded Fund based upon this Index has just been included in my universe of 160 stocks. It is the Market Vectors Gold Miners ETF. As mentioned at the beginning of this commentary, I don't understand why some ETF's such as this are not included in the major Indices. The Index itself had a good week, just about the best of all the major or Merv's Indices, with a gain of 9.4% on the week. Although gold has now surpassed all its previous highs except the one from May 2006, the AMEX Gold Miners Index still has some ways to go to get into new recent highs, as do all of the other major Indices. One often hears that the stock action leads the gold bullion. This lack of breaking into new highs may be a warning that the gold bullion move will not last long. Let's wait and see.
MERV'S PRECIOUS METALS INDICES
As mentioned earlier I am going through a comprehensive update to the component stocks of the various Merv's Indices. This should be finished in a week or two. My criteria for inclusion into the universe of 160 is very simple. Due to the nature of the program developed to produce the tables of technical information and ratings stocks must have at least one year of active North American trading history. To my Australian and African readers, sorry but I am not that familiar with the gold stocks from these regions and have not included any of them, although I understand that there are some good stocks there. Some may be included if they trade on the North American exchanges.
It was a great week for the precious metals. The US Dollar Index lost ground and everything else in the Table gained ground, and very good gains at that. The Composite Index of Precious Metals Indices has once more turned bullish with both the intermediate and long term moving average turning upward and the two momentum indicators moving into their positive zones. Having said that, there still is a problem with the Composite. It is still within a highly congested area of lateral activity and needs much more upside to break away from such congestion. Unlike gold itself the Composite Index has not made a new high from recent activity. It is always worrying when the stocks are not moving ahead of gold itself.
MERV'S GOLD & SILVER 160 INDEX
Stocks included into the universe of 160 include the 100 top precious metals stocks in terms of market value plus 60 others picked from a file of over 600 that are of great interest to speculators and gamblers. This universe is believed to be the most representative Index of precious metal stocks and represents what the overall industry is doing.
Overall, the universe had a good week, although not as good as the major North American Indices. The majors advanced by an average of 8.6% while the universe average performance was 7.2% during the week. While the majors have turned bullish the universe is still a little ways away from bullish. Although both momentum indicators have turned up they are still in their negative territory. As for the moving averages, both the intermediate and long term are still pointing downwards with the latest Index close still below the averages. For both time periods the ratings would be, at best, bullish although NEUTRAL might be a better rating as the trend is towards the positive.
With the advance during the week one could expect an advancing to declining stocks ratio to be highly tilted towards the advancers. So it is. We had 125 stocks advancing during the week (78%) and only 31 stocks declining (19%). On can't ask for much better than that. There will always be stocks moving counter to the general trend. As for the summation of individual stock ratings, that is still in the negative. Stocks in general had a miserable time over the past several weeks and that cannot be overcome by a couple of good weeks. Only the short term summation has gone bullish with a BULL rating of 70%. For the intermediate term the rating is close but still a BEAR at 51% while the long term is further behind with a rating of BEAR 62%. Although the ratings are not that high on the bearish side the bullish ratings show a much more miserable showing. Despite a couple of really good weeks recently the bullish ratings are still in the dumper. For the intermediate term the bullish rating is at 40% while for the long term it is at 28% with a long way to go to the transfer point of 50%.
With the upside action of the last few weeks one can imagine that the speculators and gamblers are starting to test the waters. With this week's performance there were many, many stocks with double digit gains. As for the speculation, there were 4 stocks that made it into the plus/minus 30% weekly move category suggesting that speculation is on the rise. As we get more of these kinds of moves we also get closer to a reversal situation so be on guard as the 30 percenters gain in numbers.
MERV'S QUAL-GOLD INDEX : MERV'S SPEC-GOLD INDEX : MERV'S GAMB-GOLD INDEX
These three Indices represent different sectors of the precious metals industry. Usually, an industry is split up into its sub-industry groups but here I do something different. My three sectors represent the “quality” level of the component stocks. We have the three quality levels, the highest quality, the mid-tier and the dogs, so to speak. The Qual-Gold Index is made up off the 30 largest precious metal stocks based upon their market value at the time of upgrade. The Spec-Gold Index is made up of the next 30 largest companies by market value. The Gamb-Gold Index is just 30 stocks that are more in the exploration business and are wannabie gold stocks. This last group is where you are more likely to find those penny stocks that could grow into the 10 and 20 baggers, or could drop into the waste bin of history. Stocks from all sectors are part of the universe.
All three sectors had good gains during the week but the Gamb-Gold Index was a little less buoyant than the other two. While the Qual and Spec-Gold Indices had about 90% of their component stocks on the advance only 67% of the Gamb-Gold stocks advanced. More of the weekly losers were still in the gambling category. Despite two good weeks (out of the last three) only the Qual-Gold Index showed a bullish overall rating that is in the bullish camp. The summation of overall individual ratings shows the intermediate term for the Qual-Gold to be at a BULL 67% level while the long term is at a NEUTRAL rating without either the bull or bear in command. As for the Spec and Gamb-Gold Indices, non are overall rated as bullish. The Spec-Gold Index is at NEUTRAL for the intermediate term and BEAR 65% for the long term. The Gamb-Gold Index is at a BEAR 65% for the intermediate term and BEAR 70% for the long term.
Chart wise the ratings are very similar for all three Indices. For the long term the charts suggest that all three are rated as – NEUTRAL, i.e. just one level above bearish. On the intermediate term both the Qual and Spec-Gold Indices are rated as BULLISH while the Gamb-Gold Index is rated as BEARISH.
From this we can see that although we are heading towards the bullish we still have some more to do to really be gung-ho bullish.
SILVER
Although a very good performer for a long time silver has not been performing up to par lately. Gold has taken the lead on the up side. This might not last and silver may once more come streaming along but for now it is lagging.
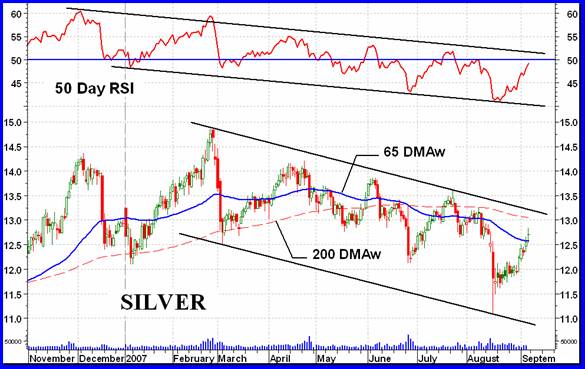
As the chart shows, silver may be seen as being inside a wide downward sloping channel. the momentum indicator is likewise. It may be yet another week or so before the chart (and indicators) turn bullish on the intermediate term and longer for the long term. For now one would be more inclined towards the gold futures. As for the stocks, there are always good and bad in both groups.
MERV'S QUAL-SILVER INDEX : MERV'S SPEC-SILVER INDEX
These two Indices are being updated along with the “gold” Indices. As often mentioned, the “gold” Indices are somewhat a misnomer as they contain both gold and silver stocks. These two indices may contain stocks with a gold presence but the component stocks are there because they have a silver presence.
Both Indices had good gains this past week but the Spec-Silver had the best. However, the Spec-Silver has been the poorest performer for some time so a good gain was to be expected somewhere along the way. When you're hit hard you often bounce hard. Looking over the charts and indicators there is nothing here yet that would cause a reversal of rating for these Indices. They are both BEARISH on both the intermediate and long term. This is further confirmed when looking at the summation of individual component ratings. Both are rated as BEAR for both the intermediate and ling term.
U.S. DOLLAR INDEX
Just a quick comment about the US $ Index. On Friday it closed at a new low since reaching a high of 92.50 in Nov of 2005. Except for a very brief period in Aug/Sep of 1992 this is its lowest value in over 20 years. This weakness in the $ may also be the driving force behind the recent gold strength. Fortunately, or unfortunately, it seems like there is more downside ahead for the $ and this may mean that gold will continue to move higher. Just something to keep tabs on.
Merv's Precious Metals Indices Table
Well, I guess I'll call it another week.
By Merv Burak, CMT
Hudson Aero/Systems Inc.
Technical Information Group
for Merv's Precious Metals Central
Web: www.themarkettraders.com
e-mail: merv@themarkettraders.com
During the day Merv practices his engineering profession as a Consulting Aerospace Engineer. Once the sun goes down and night descends upon the earth Merv dons his other hat as a Chartered Market Technician ( CMT ) and tries to decipher what's going on in the securities markets. As an underground surveyor in the gold mines of Canada 's Northwest Territories in his youth, Merv has a soft spot for the gold industry and has developed several Gold Indices reflecting different aspects of the industry. As a basically lazy individual Merv's driving focus is to KEEP IT SIMPLE .
To find out more about Merv's various Gold Indices and component stocks, please visit www.themarkettraders.com and click on Merv's Precious Metals Central . There you will find samples of the Indices and their component stocks plus other publications of interest to gold investors. While at the themarkettraders.com web site please take the time to check out the Energy Central site and the various Merv's Energy Tables for the most comprehensive survey of energy stocks on the internet. Before you invest, Always check your market timing with a Qualified Professional Market Technician
Merv Burak Archive |
© 2005-2022 http://www.MarketOracle.co.uk - The Market Oracle is a FREE Daily Financial Markets Analysis & Forecasting online publication.