


Gold Top Forming, Bearish Nearterm Outlook - Technically Precious with Merv
Commodities / Gold & Silver Sep 16, 2007 - 12:49 PM GMTBy: Merv_Burak

 Well, it's been a good upside run for gold these past few weeks but it is starting to look like a top and possible lower prices ahead.
GOLD PRICES
If one looks carefully one can spot slightly different prices for gold in various media and internet sites, all quoted as prices on the same day. One should remember that gold prices come from different sources. There is the London price. There is the Hong Kong price. There is the Sydney price. But the price I use for my data is the New York Mercantile Exchange price. Even here one has many choices. You could use the “Cash” price or you can use the prices for any one of several futures contract months. I like to use the source that has the most trading activity to obtain the best idea of where the professionals, traders, speculators and the like are operating with their money.
This is usually a very recent month although it could be a contract month some months away. This huge trading volume and open interest contract month usually lasts for a few months before expiration and having to move on to the next active contract month. When changing contract months there is usually a disparity in the prices. I go through what I can a “song and dance” routine for a few days before using the new data. Some may question my data collecting technique but what the heck, it works. So, if you have a chart for gold and it differs slightly from what you might see here, you now know why. But never assume that either one or the other chart is more accurate. You will probably be wrong 50% of the time.
GOLD : LONG TERM
Last week I showed the long term P&F chart. During this past week one additional X appears on the chart above the last X shown last week. With that new X we now have a very good picture of a price trend at a crucial position. This new X is at the same level as the X 's from the 2006 top. This is a resistance level that now has to be overcome or else there may be some serious down side ahead. We are at a potential double top or at a potential new bull market break-away point. It will be confirmed a double top only if it reverses direction and goes into new lows. It will be a new bull market break-away if it continues on its upward trek and moves into new high territory. Last week I provided some upside targets for a continuation of the bull. Should the price of gold reverse and move lower, a move to the $630 level would then cause the long term P&F chart to go bearish.
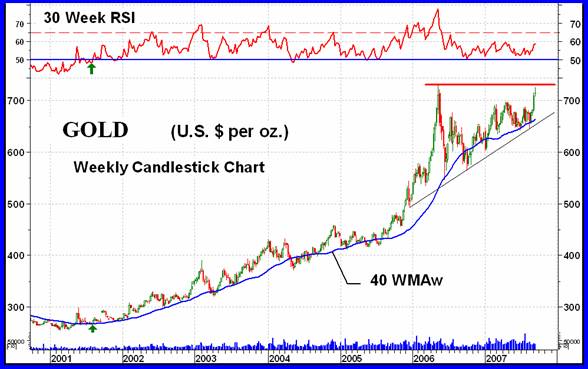
The weekly chart shown this week shows the resistance level and potential double top. There are other things of interest on this chart that one can point out. The most beneficial is the understanding if one is in a long term bull market or not. Nothing is perfect in this world but the following is about as good as it comes, to understanding a bull or bear market. To determine if we are in a bull or bear market all one needs is a long term moving average of the price (here I show the 40 week moving average) and a long term momentum indicator (here I use the 30 week RSI). When the slope of the moving average line is pointing upwards and the momentum indicator is in its positive zone, above the 50% line, we are in a bull market. This occurred on 10 Aug 2001 at $273.90 (see arrows).
To now change to a bear market you need both of these features to reverse, the moving average pointing downward and the momentum indicator below the 50% line. Up to this point we have not had both of these negatives at the same time so we are still in a long term bull market. Should the price of gold drop to the $630 level for a P&F reversal, that would also most likely cause the momentum to go negative and the moving average to turn down. AND we could then have a serious bear market on our hands. Let's hope that the existing trend continues, although short or intermediate term reversals are always expected along the way.
So, still bullish on the long term.
INTERMEDIATE TERM
The intermediate term P&F chart just keeps on moving higher without a stop. No use going into it this week. What I said last week is still okay.
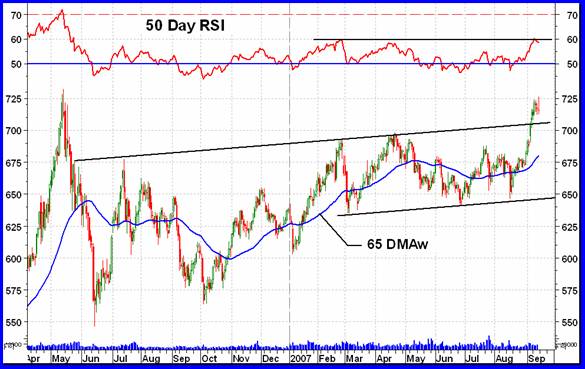
With the upside action over the past few weeks the intermediate term basic indicators remain all on the positive side. The one worry is the momentum indicator. Although the price is making new highs the momentum just can't seem to get its act together. It is still below its recent high set in Feb. We also see this lack of strength in the long term momentum. What this is warning us about is the weakening of the upward moves. As these moves weaken at some point they just give up the ghost and turn down. However, for now the intermediate term is still bullish.
SHORT TERM
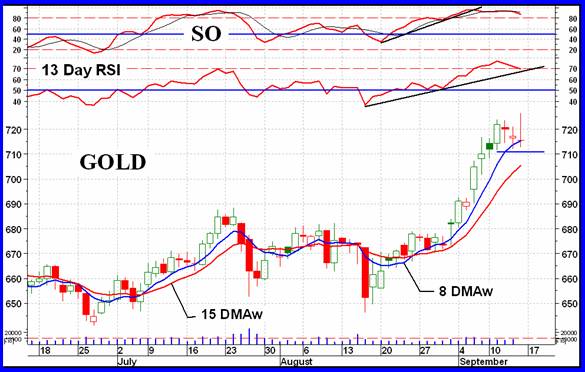
It sure looks like a topping process on-going. We have the short term momentum indicator (13 day RSI) just crossing below its overbought line. The action over the past few days has gone nowhere. The only draw back to a reversal is the moving average (15 DMAw) which is still some distance from the Friday close. On a short term basis it seems that a move below about the $700 level would most likely confirm a reversal in progress. Till then one must go with the trend in motion and that is still to the up side.
IMMEDIATE TERM
It looks like the action over the next day or two is most likely to the down side although there is some hint in the media of news that might cause a new thrust to the up side. I'll go with the chart. The trend in motion is still positive although the topping is getting pretty hard to ignore. The Stochastic Oscillator (SO) has shown weakness and is about to drop below its overbought line. The moving average (8 DMAw) has started turning and only needs a day or so to turn downward. A move below the $711 level (using the Dec Gold Futures contract price) would indicate confirmation of a new immediate trend, to the down side.
NORTH AMERICAN GOLD INDICES
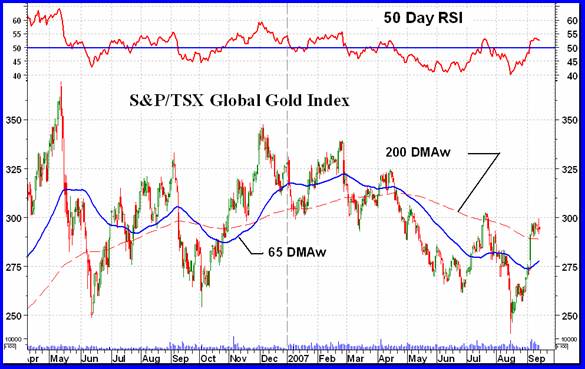
I guess it's the turn of the S&P/TSX Global Gold Index to be reviewed here this week. This is the weakest of the five major North American Gold Indices that I review. It's been in a downward spiral with continuing lower highs and lower lows for almost a year now. Maybe its time to show some spirit. Another good day or two and we just might get the first higher high since December but let's not get carried away. None of the other major Indices have made new recent highs either but they are at their upper levels of the past year of activity. With gold near break-out levels and the major Indices still holding back, this is not a sign of confidence that gold in on a roll. Something just doesn't feel good in this market.
MERV'S PRECIOUS METALS INDICES
There seemed to be quite a disconnect between the performance of the Merv's Indices and the majors. The majors advanced in the neighborhood of 2 to 4 % while the Merv's Indices were in the negative range. We seldom see this great of a disconnect. The highly weighted stocks in the majors were on a tear while the average run of the mill gold stock was going the other way. If this happens for a few more weeks then disaster may be ahead. Speculators do not run to the “quality” stocks, which are what is propelling the majors, and dumping the speculative stocks unless they had very little confidence in the overall gold or precious metals stocks. They run to safety in times of weakness. Let's see what the Indices are doing.
MERV'S GOLD & SILVER 160 INDEX
Okay, this tells us what the overall universe of precious metals stocks are doing. The Index declined by only 0.3% but still a decline versus the majors advances. There was one stock in the universe that advanced by 93% on the week. This had a significant impact on the two Indices that it is a component of. In the universe that advance alone improved the Index by about 0.6% so that without this one stock the Gold & Silver Index would have had a decline of almost 1.0%. As for the winners and losers, well the losers won out by a good margin. There were 62 stocks advancing (39%) and 93 stocks declining (58%) on the week. Despite all this there was relatively little movement in the summation of individual component stock ratings. On the short term we are at a 62% BULL rating. On the intermediate term we are at a 54% BEAR rating and on the long term we are at a 65% BEAR rating. The past few weeks of relatively good markets has not yet moved most of the stocks into the bullish category (except on the short term).
Looking at the charts and indicators we see that the Friday closing price is still below both the intermediate and long term moving average lines and both lines are sloping downward. The intermediate term momentum indicator is still in the negative zone although in an upward trend. The long term momentum indicator has just moved very slightly above its neutral line but is in more of a lateral trend than up or down.
From the charts I would still rate the long term as BEARISH while the intermediate term may be best rated as NEUTRAL. Readers have pointed out an error in last week's ratings. I wrote “For both time periods the ratings would be, at best, bullish -----“. I should have said “bearish”.
Although there are a goodly number of double digit movers this past week only two qualified for my arbitrary plus/minus 30% mover category, and one of them was a 93.2% mover to the up side.
MERV'S QUAL-GOLD INDEX : MERV'S SPEC-GOLD INDEX : MERV'S GAMB-GOLD INDEX
It may not seem like it when you review the Gold Indices Table of Technical Information and Ratings but the action this past week shows a typical “RUSH TO SAFETY” by speculators. The average performance of the three quality categories was what could be expected in such a rush. Best performance by the highest quality and the worst performance by the lowest quality. The Qual-Gold Index advanced by 1.6% showing the speculative interest in this category. The next lower quality Index, the Spec-Gold Index lost 2.6% showing the disenchantment with the second tier stocks.
The lowest quality, the gambling variety of stocks, the Gamb-Gold Index shows a loss of only 0.5% but it includes that one stock that gained 93% on the week. This stock along moved the Index value upward by 3%. Subtracting this one unusual gain we would have had the Gamb-Gold Index with a loss of 3.5% on the week as the worst performer in the Table. This rush to safety is not a sign of confidence and if we continue for another week or so that would be a real negative sign for the future. This is where it is good to have Indices which suggest the actions of different quality of stocks to see the sentiment direction.
This shift of investor interest towards the quality stocks is further noticeable in the winners and losers for the three Indices. We had 57% winners and 43% losers in the Qual-Gold Index. This dropped to 40% winners and 60% losers in the Spec-Gold Index and a still further drop to 17% winners and 77% losers in the Gamb-Gold Index. It was not a good week for the speculative stocks, in general. Of course, there is always the counter mover but these are few when the sentiment shifts.
We see this shift away from the speculative and towards the quality again when we review the summation of individual component stock ratings. For the Qual-Gold Index the summation of ratings are 87% BULL on the short term, 62% BULL on the intermediate term and NEUTRAL on the long term. For the Spec-Gold Index these are 55% BULL on the short term, NEUTRAL on the intermediate term and 60% BEAR on the long term. For the Gamb-Gold Index we get summation of ratings at NEUTRAL short term, 70% BEAR intermediate term and 77% BEAR for long term. There is a steady shift towards the bear as we go from the quality towards the gambling stocks.
As for the charts and indicators, they agree pretty much with the table ratings except for the Spec and Gamb long term rating. From the charts I get ratings of – NEUTRAL while the programmed tables have NEG.
SILVER
Once more silver in under performing gold. Gold gained 0.8% while silver lost 0.04% on the week. Silver has been in a better defined up trending channel over the past few weeks and is now sitting on top of the lower channel trend line. A move below $12.50 would break below the line and start a downward move. Since February silver has been making consistent lower tops and sporadic lower bottoms. It still has a ways to go on the up side to change that scenario. With a Stochastic Oscillator topping out and ready to drop below its overbought line the move for the next few days is not encouraging.
MERV'S QUAL-SILVER INDEX : MERV'S SPEC-SILVER INDEX
The 93% advance stock is a component of the Spec-Silver Index. Taking that one stock out of the Index gives us an Index performance similar to that of Gamb-Gold, i.e. a decline of 3.5% on the week. The Qual-Silver Index had a neutral week with a 0.0% performance, but still better than the Spec-Silver Index.
As with the Gold Indices ratings, the ratings in these two silver Indices shows the better performance of the quality stocks lately. The Qual-Gold summation of individual ratings shows a 75% BULL for the short term, 60% BEAR for the intermediate term and a 70% BEAR for the long term. The Spec-Gold ratings stand at 50% BULL for the short term, 78% BEAR for the intermediate term and 82% BEAR for the long term. Not too encouraging as yet.
Merv's Precious Metals Indices Table
Well, I guess that's it for another week.
By Merv Burak, CMT
Hudson Aero/Systems Inc.
Technical Information Group
for Merv's Precious Metals Central
Web: www.themarkettraders.com
e-mail: merv@themarkettraders.com
During the day Merv practices his engineering profession as a Consulting Aerospace Engineer. Once the sun goes down and night descends upon the earth Merv dons his other hat as a Chartered Market Technician ( CMT ) and tries to decipher what's going on in the securities markets. As an underground surveyor in the gold mines of Canada 's Northwest Territories in his youth, Merv has a soft spot for the gold industry and has developed several Gold Indices reflecting different aspects of the industry. As a basically lazy individual Merv's driving focus is to KEEP IT SIMPLE .
To find out more about Merv's various Gold Indices and component stocks, please visit www.themarkettraders.com and click on Merv's Precious Metals Central . There you will find samples of the Indices and their component stocks plus other publications of interest to gold investors. While at the themarkettraders.com web site please take the time to check out the Energy Central site and the various Merv's Energy Tables for the most comprehensive survey of energy stocks on the internet. Before you invest, Always check your market timing with a Qualified Professional Market Technician
Merv Burak Archive |
© 2005-2022 http://www.MarketOracle.co.uk - The Market Oracle is a FREE Daily Financial Markets Analysis & Forecasting online publication.