


Is the Stock Market Topping Again?
Stock-Markets / Stock Markets 2010 Jul 29, 2010 - 09:54 AM GMTBy: David_Banister

Here at TMTF, I enjoy making controversial calls based on Human Behavioral topping and bottoming patterns, often referred to as Elliott Wave Theory. This is a difficult pattern recognition model to follow as there can be numerous interpretations. Instead, I look for additional clues like sentiment indicators, a few traditional technical indicators, headlines in the news and covers of papers etc.
Recently I saw an article on Bloomberg indicating that short positions were at two year lows, with the ratio of longs to shorts at 2 year highs. Those types of indicators I use to help confirm if I’m on the right or wrong track with a forecast.
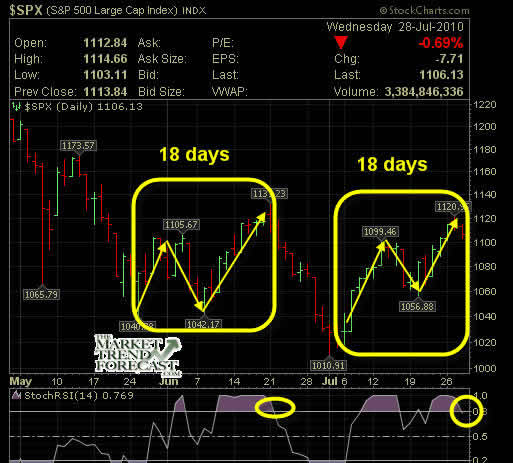
Right now I think the SP 500 and markets are topping in a counter-trend ABC-X-ABC rally that really started with the May 25th lows of 1040, to the June 21st highs of 1130, back to the Jul 1 lows of 1011, and now to 1121 so far the highs. That 1121 number is a Fibonacci 50% re-tracement of the 2007 to 2009 highs to lows, and just 9 points below a 61% re-tracement upwards of the April highs to July 1st lows. Evidence mounts now that August could prove tough for Bulls and some risk aversion here is a good trade in my opinion.
Back in late June I saw similar sentiment and Elliott Wave topping patterns in Gold as well. The headlines were bullish, the talking heads on CNBC were all saying to buy any dip in gold and stay long. A 21 month rally was topping and I went ahead and stuck my neck out and predicted a multi month correction. Since then Gold has dropped from $1243 to $1158 at it’s recent low, and should be heading to $1043 eventually if I’m right. It takes awhile to knock the sentiment down from overly optimistic levels, just like with the SP 500 top in April which I forecasted in mid April as well.
The SP 500 would need to clear 1130 aggressively for me to cave in and call 1011 the bottom. That was a 38% fibonacci re-tracement of the 13 month market rally, and it’s possible that was the bottom for sure. Normally though, you would at least get a re-test of that low, and possibly a drop to 942 area on the SP 500 which is a 50% fibonacci re-tracement of the 13 month rally. In addition, the pullback so far only lasted about 8 weeks relative to 13 months of rally, so I think there is another several weeks yet before we can call a bottom in 2010.
Below is an interesting chart showing recent action since late May in the SP 500 index. Investor’s like to act in patterns and this seems to show a good one. Best to you and your trading!
If you would like to learn more about our market forecasting service, please go to www.markettrendforecast.com to sign up for free reports and to see what we offer.
Dave Banister
CIO-Founder
Active Trading Partners, LLC
www.ActiveTradingPartners.com
TheMarketTrendForecast.com
Dave Banister is the Chief Investment Strategist and commentator for ActiveTradingPartners.com. David has written numerous market forecast articles on various sites (SafeHaven.Com, 321Gold.com, Gold-Eagle.com, TheStreet.Com etc. ) that have proven to be extremely accurate at major junctures.
© 2010 Copyright Dave Banister- All Rights Reserved
Disclaimer: The above is a matter of opinion provided for general information purposes only and is not intended as investment advice. Information and analysis above are derived from sources and utilising methods believed to be reliable, but we cannot accept responsibility for any losses you may incur as a result of this analysis. Individuals should consult with their personal financial advisors.
© 2005-2022 http://www.MarketOracle.co.uk - The Market Oracle is a FREE Daily Financial Markets Analysis & Forecasting online publication.