


Stock Market Trending Towards October Low
Stock-Markets / Stock Markets 2010 Aug 15, 2010 - 04:37 PM GMTBy: Andre_Gratian

 Current Position of the Market
Very Long-term trend - Down! The very-long-term cycles are down and if they make their lows when expected, the bear market which started in October 2007 should continue until about 2014-2015.
SPX: Intermediate trend.The index made an intermediate top at 1220 and is now in an intermediate downtrend which should come to an end in October 2010.
Analysis of the short-term trend is done on a daily basis with the help of hourly charts. It is an important adjunct to the analysis of daily and weekly charts which discusses the course of longer market trends.
Overview:
Did the resumption of the intermediate down-trend come two weeks early? There are indications that it did! There was never a question that the rally which started in early July at 1011 was only a corrective wave and not the beginning of a new uptrend, and a number of cyclical and technical factors called for it to extend to the week of Monday 8/23. However, the inability of the SPX to rise above 1129 (in spite of potential higher projections), and the sharp sell-off which has taken place from that level in the past week, make a good argument for the top to have come early.
It looks that way, but, as always, this will have to be confirmed, and the confirmation -- or invalidation -- may come as early as Monday. On the Point & Figure chart, the top which was made at the 1128-29 levels gives us two potential counts: one to 1072, and another to about 1050-55. Both are valid. There is also a Fibonacci projection to 1069, and 1069 marks a 50% retracement of the rally. Furthermore, there are two channel bottom lines which should act as support in that specific area. If the SPX manages to drop decisively below 1069, we will have a confirmation that the intermediate decline has resumed. That would not exclude some sort of a test of the high, but the odds of making a new high would be nil. Even if this level holds, surpassing 1129 over the next two weeks does not look very promising.
Analysis
Chart Pattern and Momentum
By the time the next newsletter is due -- two weeks from this date -- we will be in a better position to evaluate the decline into the 4-year cycle and give some more definite projections to that low. What most concerns us today is whether or not the rally from early July is really over, or if another wave to the area which was previously identified as a potential top is possible. The Daily Chart of the SPX gives a clear picture of what has happened, and could take place over the next couple of weeks.
I had previously identified the blue channel as an Andrews pitchfork, with the dashed line as the median. The index has demonstrated some difficulty in overcoming the median. In the process, it formed a wedge formation which is bordered by the two upper green trend lines. When a wedge pattern corrects, it will often readjust to a normal channel by dropping to the level of a parallel drawn across bottom of the move. So far, this is what we have done here. The index now rests on top of two channel lines: the green and the blue. If prices were to continue downward on Monday and break below these two trend lines, this would signal that we are now in a very weak market. On the other hand, if these lines hold, and prices bounce back up, there is a good chance that we will have started a (final) rally to the time slot identified on the chart by "top".
The indicators did signal that a top was being made and that a pull-back was likely. The bottom (A/D) oscillator gave the strongest sell indication by showing significant negative divergence. However, the momentum indicators only showed deceleration and did not support a super-negative scenario.
When we analyze the price progression, we will not be able to say that the index has made a lower low on the chart until it breaks the 1010 level, which is identified by the red horizontal line. It seems to me, that the uptrend consisted of two major phases: the first to 1099, and the next to 1129. If so, technically, the index is still in an uptrend until it trades outside the channel lines and below the red line.
Monday should give us a much better assessment of the situation. We will probably know in the first part of the day whether we intend to hold at this general level or continue to sell off.
Let's now turn to the Hourly Chart to see what it would take to show that a reversal has occurred. One of the requirements has already taken place; on Friday, the index came out of its steepest (red) channel. However, since this did not lead to a good bounce, it is an indication that the 1067 low will probably not hold. Another negative is that, on Friday, prices closed near the low of the day. The SPX is still looking for a low and, after finding it, it will have to rally out of the purple channel to signal that it has reversed.
Even though there was little strength in the price index after the low was made, the lower (A/D) oscillator had a very good recovery and this is a good indication that it will show positive divergence on the next index low.
I have drawn pink horizontal lines at the two most probable targets for Monday.
Cycles
Two weeks ago, the newsletter provided a long-term cycle map. This newsletter will be displayed on my website in the near future and will remain there as a reminder of what lies ahead.
Among the cycles that I follow, the next short-term cycle (39-day) is due on about 9/9 and should not be a factor in the near-term market trend.
There is a potential CIT (change in trend) due Monday, and this is why the near-term fate of the SPX is likely to be decided on that day.
I'll discuss the nest of cycles due in October in the next letter.
Projections
Near-term projections for the current decline: 1069-1072 (preferred), about 1055 (alternate).
Projections for the next rally will be given after we have a confirmed near-term low.
Breadth
The NYSE Summation index (courtesy of StockCharts.com) is still in an uptrend and has shown reluctance to confirm the price weakness of the past week, in spite of the fact that the RSI is overbought. This is not necessarily a sign of strength, but it indicates a lack of readiness to signal more weakness immediately ahead.
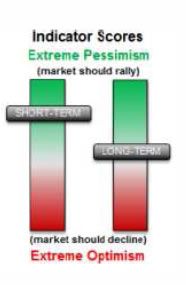
Market Leaders and Sentiment
The SentimenTrader (courtesy of same) is giving us a similar picture. The long-term indicator is neutral, but the short-term is bullish. With these readings, one should be more inclined to expect a near-term rally than an immediate continuation of the downtrend.
Gold
GLD is still recovering from its initial drop from its all-time high. When it did, it broke a long-term trend line and created a lower low. It has partially repaired this breach to its long-term uptrend by moving back above the trend line. In order to repair it completely, it would have to make a new high. This would invalidate the lower low (indicative of the possibility of having started an intermediate correction).
I have arbitrarily drawn two channels. The price is now approaching the top of the first channel where the top (heavy) line could provide resistance and stop the recovery attempt. If it were able to move out of that channel, it would still have to get beyond the top (thin) line of the second channel.
The P&F chart suggests that the recovery could extend to 119-120.
The indicators are not yet ready to give a sell signal, and this means that the P&F projection could be reached before the ETF resumes its decline.
Summary
Last week's weakness in the SPX is an indication that the interim rally within the intermediate downtrend (which started at 1220) came to an end when it reached 1129.
However, there is some evidence that at least a partial retracement of that interim phase will take place before the decline continues into the 4-yr cycle low in October.
Announcement: Be sure to check-out my new website at www.marketurningpoints.com. It is 95% complete and only needs a few finishing touches.
If precision in market timing is something which is important to you, you should consider a trial subscription to my service. It is free, and you will have four weeks to evaluate the claims made by the following subscribers:
Thanks for all your help. You have done a superb job in what is obviously a difficult market to gauge. J.D.
Unbelievable call. U nailed it, and never backed off. C.S.
I hope you can teach me about the market and the cycles. I want to be like you and be the best at it. F.J.
But don't take their word for it! Find out for yourself with a FREE 4-week trial. Send an email to ajg@cybertrails.com .
By Andre Gratian
MarketTurningPoints.com
A market advisory service should be evaluated on the basis of its forecasting accuracy and cost. At $25.00 per month, this service is probably the best all-around value. Two areas of analysis that are unmatched anywhere else -- cycles (from 2.5-wk to 18-years and longer) and accurate, coordinated Point & Figure and Fibonacci projections -- are combined with other methodologies to bring you weekly reports and frequent daily updates.
“By the Law of Periodical Repetition, everything which has happened once must happen again, and again, and again -- and not capriciously, but at regular periods, and each thing in its own period, not another’s, and each obeying its own law … The same Nature which delights in periodical repetition in the sky is the Nature which orders the affairs of the earth. Let us not underrate the value of that hint.” -- Mark Twain
You may also want to visit the Market Turning Points website to familiarize yourself with my philosophy and strategy.www.marketurningpoints.com
Disclaimer - The above comments about the financial markets are based purely on what I consider to be sound technical analysis principles uncompromised by fundamental considerations. They represent my own opinion and are not meant to be construed as trading or investment advice, but are offered as an analytical point of view which might be of interest to those who follow stock market cycles and technical analysis.
Andre Gratian Archive |
© 2005-2022 http://www.MarketOracle.co.uk - The Market Oracle is a FREE Daily Financial Markets Analysis & Forecasting online publication.