


UK Government Bonds Gilts vs Gold, Vying for “Safe Haven” Money
Interest-Rates / UK Interest Rates Aug 25, 2010 - 12:57 PM GMTBy: Gary_Dorsch

 “I care not what puppet is placed upon the throne of England to rule the Empire on which the sun never sets. The man that controls Britain’s money supply controls the British Empire, and I control the British money supply,” declared Baron Nathan Mayer de Rothschild, - once the richest man in Europe. In 1840, NM Rothschild was appointed as the bullion broker to the Bank of England, and went on to operate the Royal Mint Refinery in 1852. Nathan gained a position of such enormous power in the City of London that he was able to supply enough money to the Bank of England to enable it to avert a market liquidity crisis.
Nowadays, the Bank of England (BoE), - also known as the “Old Lady” of Thread-needle Street, - has full control over the British money supply, with a monopoly on issuing banknotes in England and Wales. It also controls what’s left of Britain’s badly depleted gold reserves. In May 1997, the BoE was granted the autonomy to conduct monetary policy, and with it the power to set interest rates.
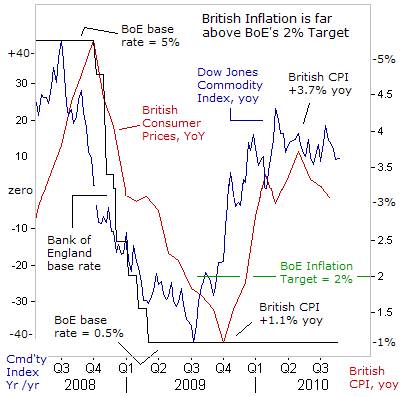
 The BoE’s mandate centers on two primary goals, - to insure stable consumer prices and to oversee the British pound. Stable prices are defined by the boundaries of the government’s 2% inflation target. In theory, the BoE aims to meet this target by hiking its base lending rate, if inflation overshoots the CPI target by more than 1%. The BoE is expected to lower its base rate, if inflation falls below 1%. But in reality, the BoE will ignore its mandate to combat above target inflation, if it’s in the best interest of the UK-economy. The BoE chief must write a letter to the Chancellor of the Exchequer explaining why it’s pursuing an asymmetrical monetary policy.
In the aftermath of the bankruptcy of Lehman Brothers in September 2009, the world economy was plunged into an unprecedented and synchronized meltdown. The UK’s economy was caught in the grips of a vicious contraction that wiped out 6% of its GDP. Suddenly, the outlook for Britain’s CPI turned exceedingly negative, and the BoE decided to take extraordinary actions in order to prevent the CPI from falling below 1%, and to fend-off the specter of deflation.
In March 2009, the BoE broke new ground in its long checkered history, when it cleared the way for “quantitative easing” (QE) – radical measures used to combat deflation and unblock frozen credit markets. The BoE said it would buy huge quantities of Gilts, aiming to pump cash into the banking system and restart the flow of lending to businesses and households. “If we were to go to the wider operation, the BoE could decide that it wished to conduct such operations financed by the creation of central bank money,” said BoE chief King on Feb 11, 2009.
Two weeks later, BoE chief King was granted approval by the Exchequer to start the printing presses, - creating up to £150-billion, in order to buy up everything from corporate bonds to government debt. In theory, injecting liquidity into the banks provides new funds to lend to businesses, homebuyers, or consumers. However, very little of the QE tidal wave actually trickled down to the private sector. Instead, it was hoarded by greedy bankers, seeking to rebuild their own balance sheets that been so badly damaged by the financial crisis. Much of the QE-cash was simply funneled by banks into higher yielding government and blue-chip company bonds.
 The original blueprints of QE were designed by the Bank of Japan (BoJ), which tried very similar tactics a decade ago, after most of the Tokyo’s fiscal stimulus tactics failed. As everyone knows, QE failed to pull Japan out of its post Nikkei-bubble rut. Whereas the BoJ injected 5% of GDP into its QE-scheme, printing money to buy up government bonds (JGB’s), the BoE on the other hand, committed to printing the equivalent of 13% of its GDP. Although QE has fueled huge bubbles in the G-7 bond markets, it’s failed to stimulate economies, because the transmission mechanism, between the central bank and the real economy, is clogged-up by tight-fisted bankers - who are focused on their annual bonuses.
About a year after the BoE began a series of rapid-fire rate cuts, - slashing its base rate to an all-time low of 0.50%, and unleashing QE, - purchasing a total of £200-billion over 12-months, the BoE began to see the fruits of its labor. The BoE’s efforts to turn back a deflationary spiral in the UK-economy were greatly aided by a massive devaluation of the British pound, which lost a quarter of its trade-weighted value since the start of 2007. Most importantly, the Federal Reserve’s $1.75-trillion QE-scheme had fueled a sizeable rally in the Dow Jones Commodity Index.
By April 2010, British consumer prices (CPI) were +3.7% higher than a year earlier, aided by surging commodity prices. BoE chief Mervyn King, wrote a public letter to Chancellor of the Exchequer George Osborne, because the CPI figure rose more than 1% above the 2-percent inflation target. Retail Price Inflation, (RPI) a measure used to gauge the cost of living in wage negotiations, accelerated at a +5.3% clip in April, the fastest pace since 1991. But Mr King was still worried about deflation.
Much will depend upon the future direction of commodity markets, a key driver of the British CPI. There’s renewed fears that a still crumbling housing market and high unemployment will push the US-economy into a “double-dip” recession, - rattling world stock markets. Rallies in key industrial commodities are unraveling, as China’s housing bubble has peaked and factory output is falling, following tightening moves by its central bank. Japan’s economy is suffocating from a strong yen, and Greece’s 10-year bond yield is +900-basis points above German yields, indicating the Euro-zone debt crisis is still brewing beneath the surface. Any of these time bombs, if they explode, could rock the global economy and industrial commodities.
 A poker-faced BoE chief is privately worried about the possibility of Japanese style deflation spreading to Western nations. BoE chief King thinks any triumph against deflation is illusionary, and instead, believes the CPI gauge has already peaked and would eventually fall under its 2% target within a year, because of “substantial spare capacity in the economy, though policy makers are very conscious of price risks.”
Mr King refuses to rule out a further expansion of the money supply – “QE-2,” even after the BoE monetized 90% of the UK’s budget deficit in the past fiscal year. “We stand ready either to expand or reduce the extent of monetary stimulus as needed,” he said. So far, Mr King’s prognostications are on target. The DJ-Commodity Index’s inflation rate has flattened out, at a lower plateau, up +10% from a year ago, after peaking at +24% in February, while the British CPI has eased to +3.1%.
On August 18th, the BoE voted 8-1 to keep its base lending rate pegged at 0.50% and its bond-portfolio steady at 200-billion pounds. “The committee considered arguments in favor of a further easing” and “there were also arguments in favor of a small increase in bank rate. Increases in the prices of some agricultural commodities suggest that the increased volatility of CPI inflation in recent years might continue.” Still, “the weight of evidence continues to suggest that the margin of spare capacity is likely to bear down on inflation,” the BoE said.
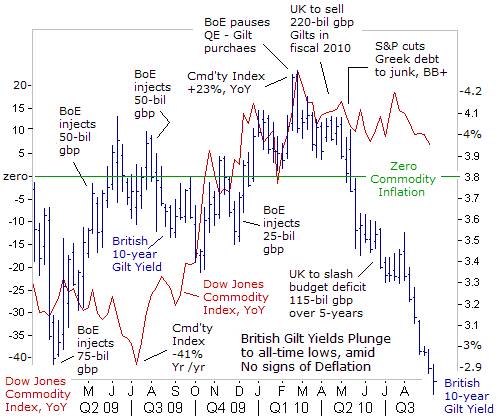 Since the BoE unleashed QE in March 2009, there was a revival of commodity inflation, helping to push the British 10-year Gilt yield about 125-basis points higher to a peak of 4.25% in February 2010. The peak in gilt yields coincided with commodity inflation reaching �percent. On Feb 4th, the BoE halted its QE-printing spree at £200-billion, in order to rescue the British pound, which was in the grips of a death spiral, tumbling to a 14-year low of $1.3675.
Just three-months ago, British gilt yields were hovering near 4-percent. Bond dealers were fretting about the former Labor government’s plan to sell a record £220-billion of gilts this year. That amount was 50% more than the £146-billion sold in the fiscal year that ended March 31st. The UK’s budget deficit was projected to reach £175-billion, or 12.4% of gross domestic product. That’s the biggest shortfall in the G-20 nations and matches the forecast for Greece.
Yet defying worries over the massive build-up of UK government debt, the yield on Britain’s 10-year Gilt plunged 100-basis points over the past three-months to below 3%, a historic low point, and caught many traders by surprise. Two-year gilt yields hit a record low of 0.60%, and five-year yields fell to a record low of 1.67-percent. However, the sharp plunge in gilt yields is out-of-sync with the commodity indexes, which are stable and still in positive territory, supported by a 44% jump in wheat.
With the British CPI running at +3.1%, or slightly above the 10-year Gilt yield, and the RPI significantly above that, traders buying gilts at these levels would see their interest payments wiped out by inflation in real terms. Thus, what value could there be in buying British gilts? Perhaps the BoE might soon unleash QE-2, thus soaking up more of the outstanding supply of Gilts, and creating a short squeeze. For this reason, the bears suspect that British gilts are over-extended into bubble territory, and once it becomes widely recognized that the deflation scare is a nothing more than a false illusion, - the Gilt bubble will inevitably burst.
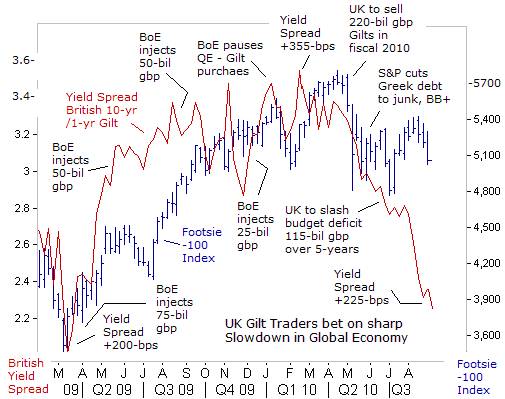 Ten-year gilt yields have fallen steadily from as high as 4.25% set in February, when worries about Britain’s record budget deficit were at their peak. The yield spread between the British 10-year gilt and the 1-year T-bill rate has shrunk by 130-basis points, to +224-bps today. The last time the yield spread was this narrow, the global economy was at risk of sliding into a 1930’s style depression.
What’s the meaning of the sharp narrowing of the UK’s yield curve? While much of the downward move in Gilt yields is linked to fears about a “double-dip” recession in Japan and the United States, - in London, there’s also expectations that austerity measures introduced by the Conservative/Liberal Democrat coalition could push Britain’s economy back into recession. Britain’s ruling coalition produced the harshest budget in a generation on June 22nd, slashing public spending by over £100-billion, raising the VAT tax to 20%, and slapping a levy on banks, in order to cut a record budget deficit to almost nothing in five years.
However, while Gilts have rallied strongly on bets the UK-economy will topple into recession by the first half of 2011, the FTSE-100 Index remains resilient. Chancellor George Osborne wrapped his tough austerity measures in rhetoric about fairness and burden sharing, but tilted the budget in favor of business. The corporate income tax rate is to be cut from its present level of 28% to 24-percent. This will give the UK the lowest level of corporate taxation in any developed economy.
FTSE-100 companies equal about 85% of the market capitalization of the London Stock Exchange, and nearly half the companies are headquartered outside the UK. Roughly one-third of the FTSE is concentrated in the natural resource sector. Thus, the Footsie is viewed as a global bellwether, rather than a reflection of the state of the British economy. Right now, the sharp downward trajectory of UK-gilt yields is flashing warning signals of a sharp downturn in the British economy, which could trigger deflation in wages and UK home prices.
Bond traders are usually the first to sniff out trouble, - long before its recognized by the maniacal speculators in the stock market. The bond vigilantes have sounded an early warning siren at every stage of the global financial crisis. Historically, the lag-time between an inverted yield curve, and a subsequent bear market in stocks, has varied from several months to as long as a year. With the BoE’s base rate near zero-percent, an inverted yield curve is improbable, but a sharp narrowing of the curve could also do the trick, of unnerving die-hard stock market bulls.
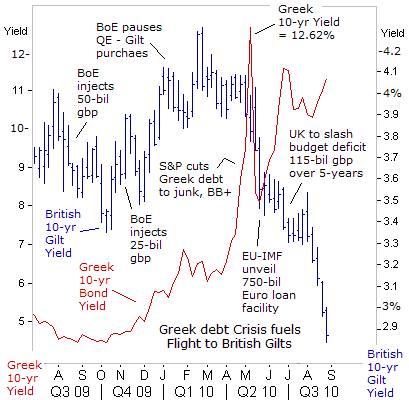 One of the catalysts behind the stunning collapse in British gilt yields to historic lows is the Greek debt crisis, which is still brewing beneath the surface, despite the attempts of Euro-zone politicians and the IMF to conceal the gravity of the situation. The yield on Greece’s 10-year bond continues to ratchet upwards, climbing to as high as 11.30% today, and not far below its all-time high of 12.62%, hit on May 7th. The yield on Greece’s 10-year bond is nearly +850-bps above the British gilt yield, a clear sign of trouble that lies ahead.
On June 10th, famed hedge fund trader George Soros, said “we have just entered Act II” of the global financial crisis. “The collapse of the financial system as we know it is real, and the crisis is far from over. Indeed, we have just entered Act II of the drama. When the financial markets started losing confidence in the credibility of sovereign debt, Greece and the Euro have taken center stage, but the effects are liable to be felt worldwide. Credit default swaps, which insure bondholders against the risk of a default, are dangerous and a “license to kill,” Soros warned.
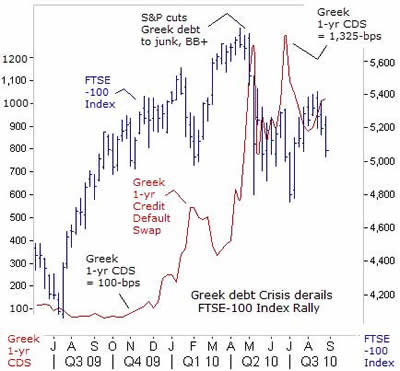
The explosive surge in credit default swaps (CDS), linked to Greece’s debt jolted the financial markets in May, wiping out more than $4-trillion from global stock markets. Today, it costs about $1-million to insure $10-million of Greek debt from the odds of default, or a restructuring of principal. Many portfolio managers are opting to swap out of Greek bonds, and buying British gilts or German bunds. Finding a buyer for Greek bonds has become more difficult since the European Central Bank (ECB) stopped purchasing the toxic debt five weeks ago.
While England’s economy grew by +1.1% in the second quarter and Germany’s expanded by a record +2.2%, moving in the opposite direction was the Greek economy, which shrank -1.5% in the second quarter. The Greek jobless rate jumped to 12%, with more than 600,000 citizens out of work. Greece’s downward spiral accelerated as a barrage of austerity measures, - wage and pension cuts plus tax increases, - sapped consumer demand. Traders in Greek bonds figure that at some point in the near future, Athens will declare a moratorium on its debt payments, and demand a restructuring of principal, from its creditors.
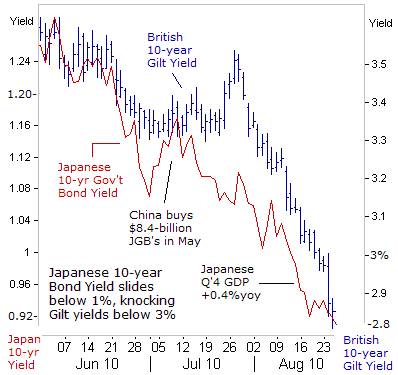 BoE officials worry that Japanese style deflation could spread to Europe, but it’s already a reality in the G-7 bonds markets. Japan’s 10-year government bond (JGB) yield slipped to 0.90% this week, to its lowest level in seven years, and in turn, knocked British 10-year gilt yields below 3-percent. Japanese MOF data showed that
Japanese investors bought a net 8.2-trillion yen ($103-billion) in higher yielding foreign bonds in June and July, a record for a two-month period, including 6-trillion yen in net buying by Japanese banks, who are able to hedge their foreign currency exposure through swaps or forward contracts.
Japan’s economy grinded to a halt in the second quarter, adding to headaches at the Japanese ministry of finance, (MoF), as it grapples with deflation and a powerful rise in the yen. Beijing is becoming a significant buyer of yen, having bought more than 1.7-trillion yen ($20-billion) of Japanese bonds in the first five months of 2010, far surpassing its record of 256-billion yen in 2005. Zhang Ming, an economist with the Chinese Academy of Social Sciences, explained on August 11th, “The choice between Japanese and US-debt is not a choice between good and bad. Rather, it is being compelled to pick between bad and worse,” Zhang said.
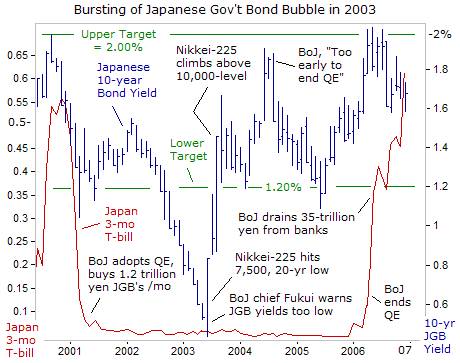
Deflationist enthusiasts, - in a mad scramble to gobble-up British gilts and Japanese bonds, - also face a major price risk that could lead to severe losses. The last time 10-year JGB yields traded below 1% was in mid-2003, when yields fell to a historic low of 0.43-percent. Traders were lured into bidding-up JGB’s, under the influence of the BoJ’s hallucinogenic QE-drug. However, when the JGB bubble did finally burst, yields suddenly reversed and surged sharply higher to 1.65%.
JGB losses continued to mount through 2006, when the BoJ scrapped its QE-scheme, by draining 35-trillion yen out of the banking system. JGB 10-year yields climbed to as high as 2%, where MoF officials drew a red-line in the sand. Remarkably, long-term buy-and-holders of JGB’s from the 2003 bubble period, - have a chance to fully recoup their long-term losses in the weeks ahead. Thus, buyers of JGB’s in today’s market must tread carefully, as potential sellers are watching every tick.
 The G-7 government bond markets are highly synchronized, with British, Canadian, German, Japanese, and US-Treasury yields moving in the same direction. The British gilt market has simply hitched a ride to the G-7 bond bandwagon. But what key events should traders be watching for, that could signal a major top in the G-7 bond markets, and a deflating of the bubble? The answer to this question is available in the latest edition of the Global Money Trends newsletter.
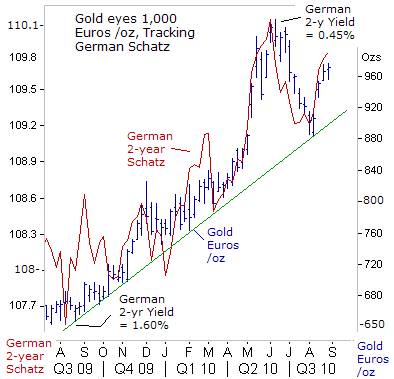
Interestingly enough, the ghost of deflation that’s haunting the G-7 bond markets hasn’t altered gold’s upward trajectory. In Europe, the yellow metal found solid support at an upward sloping trend-line, residing at the 890-Euros /oz level in July, before rebounding to 980-euros /oz today. Gold is buoyed by the ECB’s decision to extend its lending of unlimited amounts of Euros to banks, through short-term loans into early 2011, signaling that its liquidity largesse will continue. Euro-zone banks have become hooked on cheap money, and would suffer big losses, if the ECB ever attempted to drain liquidity in a meaningful way.
Furthermore, Gold retains its resiliency amid renewed signs of trouble in the Irish bond market, where 10-year yields have ratcheted higher to 5.75% today. More importantly, yields on Ireland’s 10-year bonds have soared to +360-basis points above the German 10-year bund, the widest spread since 1991, and surpassing the previous peak level of +310-bps reached on May 7th. Dublin’s cost of rescuing the Anglo Irish Bank will exceed 25-billion Euros, which is equivalent to 15% of Ireland’s GDP and 75% of what’s collected in taxes, thus making Irish bonds risky.
At the moment, Gold is competing with British gilts and other G-7 government bonds, as a “safe haven” in the event of a “double-dip” in global stock markets, and a further breach in confidence in owning Greek and Irish government bonds. At the end of the day, the BoE and the Fed might be forced to start QE-2, and the BoJ could begin QE-3, in order to combat a looming threat of a deflationary spiral in their local economies. If correct, which asset class, G-7 government bonds or gold, would exhibit the most upside potential? The answer is elementary, of course.
This article is just the Tip of the Iceberg of what’s available in the Global Money Trends newsletter. Subscribe to the Global Money Trends newsletter, for insightful analysis and predictions of (1) top stock markets around the world, (2) Commodities such as crude oil, copper, gold, silver, and grains, (3) Foreign currencies (4) Libor interest rates and global bond markets (5) Central banker "Jawboning" and Intervention techniques that move markets.
By Gary Dorsch,
Editor, Global Money Trends newsletter
http://www.sirchartsalot.com
GMT filters important news and information into (1) bullet-point, easy to understand analysis, (2) featuring "Inter-Market Technical Analysis" that visually displays the dynamic inter-relationships between foreign currencies, commodities, interest rates and the stock markets from a dozen key countries around the world. Also included are (3) charts of key economic statistics of foreign countries that move markets.
Subscribers can also listen to bi-weekly Audio Broadcasts, with the latest news on global markets, and view our updated model portfolio 2008. To order a subscription to Global Money Trends, click on the hyperlink below, http://www.sirchartsalot.com/newsletters.php or call toll free to order, Sunday thru Thursday, 8 am to 9 pm EST, and on Friday 8 am to 5 pm, at 866-553-1007. Outside the call 561-367-1007.
Mr Dorsch worked on the trading floor of the Chicago Mercantile Exchange for nine years as the chief Financial Futures Analyst for three clearing firms, Oppenheimer Rouse Futures Inc, GH Miller and Company, and a commodity fund at the LNS Financial Group.
As a transactional broker for Charles Schwab's Global Investment Services department, Mr Dorsch handled thousands of customer trades in 45 stock exchanges around the world, including Australia, Canada, Japan, Hong Kong, the Euro zone, London, Toronto, South Africa, Mexico, and New Zealand, and Canadian oil trusts, ADR's and Exchange Traded Funds.
He wrote a weekly newsletter from 2000 thru September 2005 called, "Foreign Currency Trends" for Charles Schwab's Global Investment department, featuring inter-market technical analysis, to understand the dynamic inter-relationships between the foreign exchange, global bond and stock markets, and key industrial commodities.
Copyright © 2005-2010 SirChartsAlot, Inc. All rights reserved.
Disclaimer: SirChartsAlot.com's analysis and insights are based upon data gathered by it from various sources believed to be reliable, complete and accurate. However, no guarantee is made by SirChartsAlot.com as to the reliability, completeness and accuracy of the data so analyzed. SirChartsAlot.com is in the business of gathering information, analyzing it and disseminating the analysis for informational and educational purposes only. SirChartsAlot.com attempts to analyze trends, not make recommendations. All statements and expressions are the opinion of SirChartsAlot.com and are not meant to be investment advice or solicitation or recommendation to establish market positions. Our opinions are subject to change without notice. SirChartsAlot.com strongly advises readers to conduct thorough research relevant to decisions and verify facts from various independent sources.
Gary Dorsch Archive |
© 2005-2022 http://www.MarketOracle.co.uk - The Market Oracle is a FREE Daily Financial Markets Analysis & Forecasting online publication.