


Strong GDP Growth For German Economy, Weak for U.S. Economy
Economics / Global Economy Aug 29, 2010 - 06:56 AM GMTBy: EconGrapher

 This week we take a look at GDP stats from the robust German economy, and the less than robust US economy. Then we look closer at the US situation; reviewing the existing home sales data, and consumer sentiment data. We then wrap up with a review of the July trade figures from Japan.
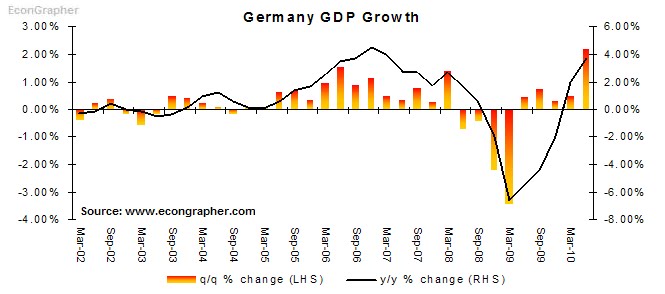
1. German GDP
Germany proved itself to be one of the strongest developed economies (and certainly within the EU). Overall the German economy grew 2.2% compared to the previous quarter (the fastest growth rate since East and West Germany reunified). The surge in growth was driven by strong exports, up 8.2% in Q2; boosted by trade with China and the US... which should immediately raise some concerns given the slowing of those two economies. However equipment investment (up 4.4%) also grew relatively strongly; and consumer spending returned to growth (0.6%). So there are growing signs of fundamental strength in the German economy, as well as from the rebound in international trade.
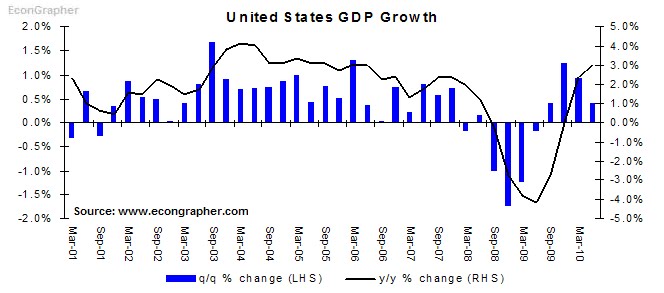
2. US GDP
The US economy showed further signs of descending into the double dip as the second quarter GDP growth rate was downgraded to 1.6% annualised (0.4% q/q) vs initial reading of 2.4% annualised (0.6% q/q). The downgrade was driven by a higher net export deficit and smaller gain in inventories; as well as residential investment and government purchases; these were partially offset by slight upward adjustments to personal consumption and nonresidential fixed investment. From here the vulnerability and weight of risks is almost certainly weighted to the downside, there's a weakening housing market, a still high unemployment rate, a necessary period of deleveraging to go through; so the weight of probabilities is for a dip back into negative growth. The best case scenario would be for stagnant growth (the muddle ages).
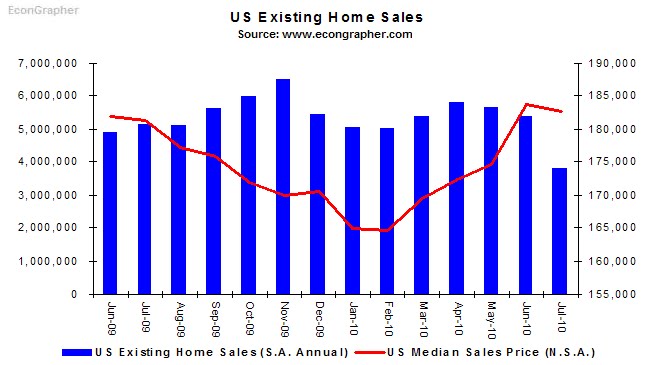
3. US Existing Home Sales
US existing home sales confirmed concerns by many that the US housing market is still a major risk area for the US economic recovery. On a seasonally adjusted annualised basis existing home sales dropped to 3.83 million from 5.37 million in June (consensus was for a dip to just 4.65m). Supply at the current sales rate expanded from 8.9 months to 12.5 months - the worst reading in 11 years. For now prices have only dipped slightly, with reluctant sellers not yet giving in, the median price dipped to $182,600 from $183,700 in June. So, as noted above, unless something radical happens, the US housing market remains a critical threat to the US economic recovery.
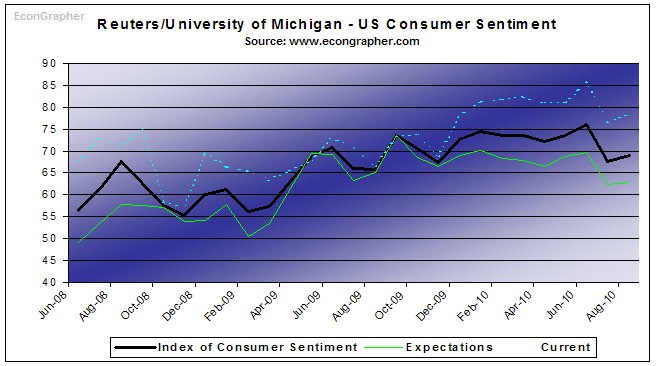
4. US Consumer Sentiment
On a similar vein, the Reuters/University of Michigan Consumer Sentiment index crept along, rising slightly from the July reading (68.9 vs 67.8). Expectations improved less; 62.9 vs 62.3 and current conditions improved to 78.3 from 76.5. Overall the impact of scarce jobs and stagnating incomes have spurred consumers to hunker down; taking a more defensive outlook with the whole deleveraging and cash reserve building behaviour becoming more and more endemic (and for good reasons). The data lines up with the weak housing data, and slowing trend in the GDP data; unless the manufacturing sector really pulls a rabbit out of the hat; and exports somehow surge, the outlook keeps coming back to the scenario of a double dip.
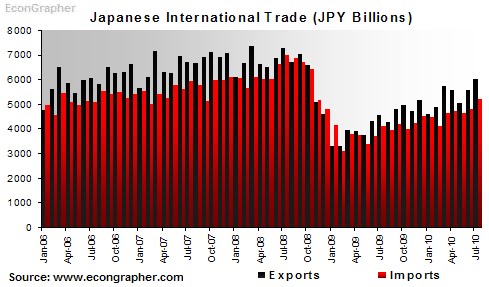
5. Japan Trade
Japan saw a continuation of the recovery in exports (and imports), but at a slightly slower pace. Looking to the chart its clear the trend is showing a recovery, but still; exports are well below trend, and are still yet to return to levels seen prior to the crash in global trade. Exports climbed 23.5% year on year to 5.983 trillion yen ($71 billion), the year on year growth rate in June was 27.7%. Interestingly the key driver of growth was continued sales of cars and electronic components to emerging economies like China and other Asian countries; which is promising somewhat given their higher potential growth rates. But the Japanese Yen has been appreciating, and this could reduce export competitiveness. So for Japan, trade remains the key to sustaining economic growth, but the downside risks remain.
Summary
So we saw two key developed economies provide updates on their GDP situations. On the one hand there was Germany - albeit caught up still with some of the wider EU risks - which was showing surprising resilience, with strong exports, growth in investment, and even a return of consumer spending. The signs are for continued strength in the German economy.
The US however showed weakness on almost all fronts; and the housing data and consumer sentiment data did nothing to provide comfort. It's becoming increasingly harder to get to any other conclusion than for a double dip. The best case is likely to be a prolonged period of stagnant growth, aka the muddle ages of the recovery.
Over to Japan, the challenges of deflation (which increased to -1.1% in July), high government debt, and low consumer spending; were carried once again by strength in trade. But again, as some of its key trade partners show signs of slowing, and as the Yen appreciates, the outlook is probably also for relatively stagnant growth at best.
Sources
1. OECD Stats stats.oecd.org
2. Bureau of Economic Analysis www.bea.gov
3. Realtor.org www.realtor.org
4. Reuters/Univesity of Michigan customers.reuters.com
5. Japan External Trade Organization www.jetro.go.jp
Article Source: http://www.econgrapher.com/top5graphs28aug.html
By Econ Grapher
Bio: Econ Grapher is all about innovative and insightful analysis of economic and financial market data. The author has previously worked in investment management, capital markets, and corporate strategy.
Website: http://www.econgrapher.com
Blog: http://econgrapher.blogspot.com
© 2010 Copyright Econ Grapher - All Rights Reserved
Disclaimer: The above is a matter of opinion provided for general information purposes only and is not intended as investment advice. Information and analysis above are derived from sources and utilising methods believed to be reliable, but we cannot accept responsibility for any losses you may incur as a result of this analysis. Individuals should consult with their personal financial advisors.
© 2005-2022 http://www.MarketOracle.co.uk - The Market Oracle is a FREE Daily Financial Markets Analysis & Forecasting online publication.