UK FTSE 100 and Germany's DAX Index - Elliott Wave Stock Market Analysis
Stock-Markets / Elliott Wave Theory Sep 30, 2007 - 02:37 AM GMT Both major stock markets are completing tops , and are about to start multi-week declines.
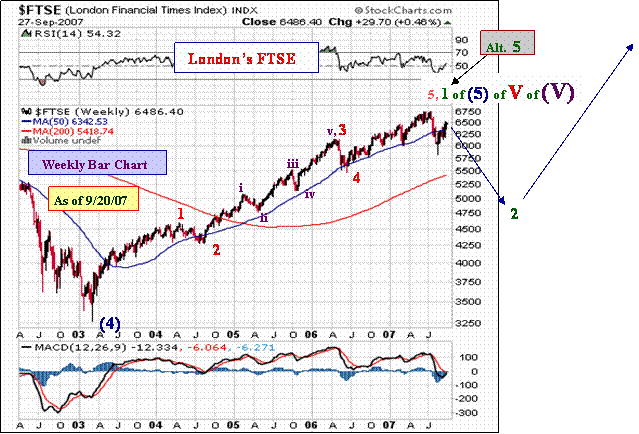
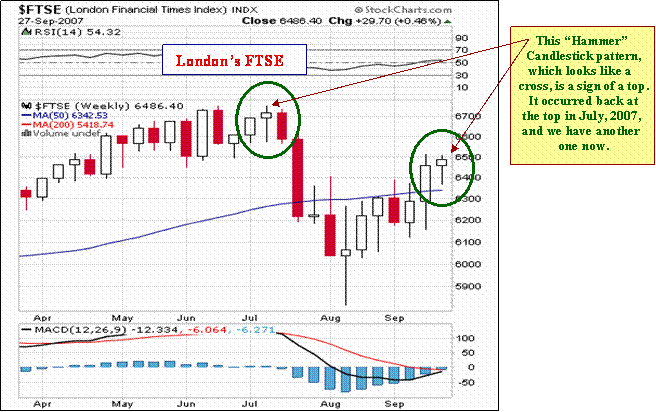
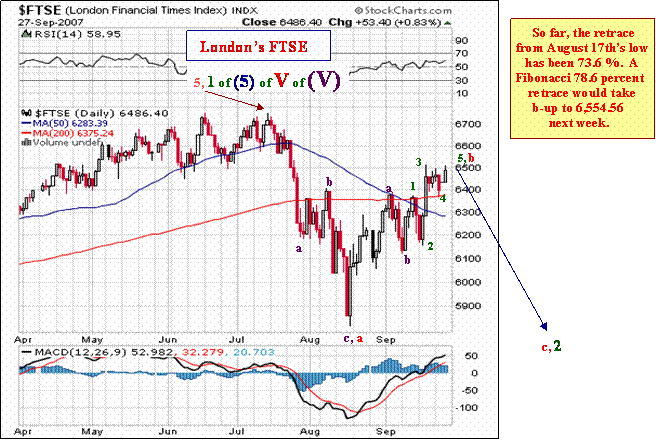
The London FTSE topped in July, 2007, and since has been tracing out the first two legs of an a- down, b -up, c- down Intermediate degree wave 2 decline. Wave b- up has retraced about 73.6 percent of the decline from July into August. That wave should complete soon. Then a strong decline, wave c- down should begin. A Fibonacci .786 retrace of wave a- down would take the FTSE up as high as 6,554.
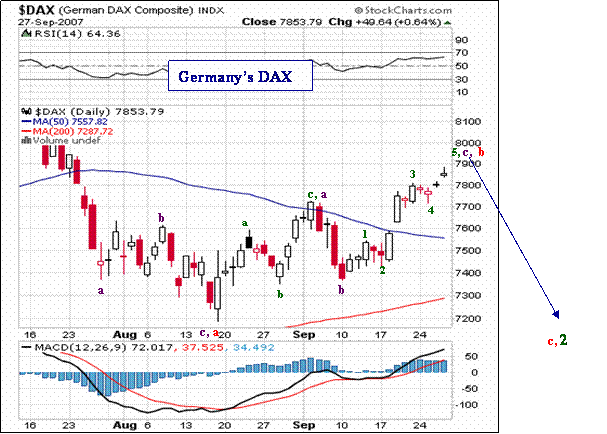
Germany's DAX has also failed to exceed its July highs, and is following a similar path as the FTSE. The DAX has retraced 72 percent of the summer decline. A Fibonacci .786 (the quare root of phi, .618) would take the DAX up to 7,945.
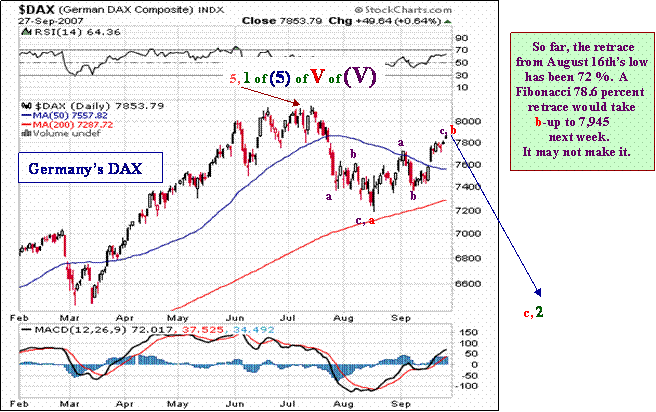
Wave c- down into an Intermediate wave 2 bottom could commence as soon as this week, if many of the signals affecting U.S. markets apply to these two indices.
We offer an expanded 48 page weekend newsletter to Subscribers at www.technicalindicatorindex.com . We also cover the US on a Daily basis. We cover the Australia daily and weekly, and the London FTSE, and German DAX weekly. You can get a FREE 30 day Trial Subscription by going to the website and clicking on the button at the upper right of the Home page.
“Jesus said to them, “I am the bread of life; he who comes to Me
shall not hunger, and he who believes in Me shall never thirst.
For I have come down from heaven.
For this is the will of My Father, that everyone who beholds
the Son and believes in Him, may have eternal life;
and I Myself will raise him up on the last day.”
John 6: 35, 38, 40
To receive a copy of this weekend's 48 page USA report, and the Australia report, simply go to www.technicalindicatorindex.com and click on the Subscribe Today buttons. You can subscribe for as short a time as one day for $12.95, which gives you access to our entire site including all reports for one day, or you can grab one of our popular and inexpensive longer term subscriptions, including the 6 months for the same price as a 3 months subscription, a mere $89. Also, many folks have chosen to grab our one year for $199, or our two year for $359, which also gets you a copy of the book, Elliott Wave Principle. .
Don't be without our market coverage during the coming volatile period. Find out what the deteriorating US Dollar means to markets and to your finances.
by Robert McHugh, Ph.D.
technicalindicatorindex.com
If you would like a Free 30 day Trial Subscription , simply go to www.technicalindicatorindex.com , and click on the FREE Trial button at the upper right of the home page. A subscription gains you access to our buy/sell signals, our Market Analysis Newsletters, Traders Corner, our model Conservative Investment Portfolio, Guest Articles, and our Archives.
Robert McHugh Ph.D. is President and CEO of Main Line Investors, Inc., a registered investment advisor in the Commonwealth of Pennsylvania, and can be reached at www.technicalindicatorindex.com. The statements, opinions, buy and sell signals, and analyses presented in this newsletter are provided as a general information and education service only. Opinions, estimates, buy and sell signals, and probabilities expressed herein constitute the judgment of the author as of the date indicated and are subject to change without notice. Nothing contained in this newsletter is intended to be, nor shall it be construed as, investment advice, nor is it to be relied upon in making any investment or other decision. Prior to making any investment decision, you are advised to consult with your broker, investment advisor or other appropriate tax or financial professional to determine the suitability of any investment. Neither Main Line Investors, Inc. nor Robert D. McHugh, Jr., Ph.D. Editor shall be responsible or have any liability for investment decisions based upon, or the results obtained from, the information provided. Copyright 2007, Main Line Investors, Inc. All Rights Reserved.
Robert McHugh, Ph.D Archive |
© 2005-2022 http://www.MarketOracle.co.uk - The Market Oracle is a FREE Daily Financial Markets Analysis & Forecasting online publication.
Comments
|
Tamer Gamal
19 Apr 08, 13:50 |
FTSE Analysis
Wave (iii) is the shortest ......Incorrect count. Hammer candles are bottom reversals....not top reversals |


