


The Global Economy and the 4-year Stock Market Cycle
Stock-Markets / Cycles Analysis Sep 27, 2010 - 11:31 AM GMTBy: Clif_Droke

 One of the biggest fears underscoring the financial market since the 2008 credit crisis has been global economic growth. Investors have worried that a global economic slowdown would all but derail what little economic momentum the U.S. has experienced since the recovery started in March 2009. The latest 4-year cycle bottom is just days away, as we’ve discussed in previous reports. In previous decades the 4-year cycle was mainly a U.S. equity market cycle affecting only the U.S. But in today’s reticular global economy where all the major developed and emerging economies are becoming increasingly dependent on each other, the long-term yearly cycles are becoming more fully global phenomena.
Several benchmark global stock market indices are at or very near 52-week highs. Some, in fact, have already exceeded their highs from 2007-2008 prior to the global financial crisis. South-East Asia is a case in point. Stock markets in SE Asia are at levels not seen since the 1997 “Asian Contagion” financial crisis. Thailand leads the way. Thai stocks and the Thai currency, the baht, are currently trading at 13-year highs. As reported in the latest issue of The Economist, “The IMF predicts full-year growth of 7%, ahead of Malaysia, Indonesia and the Philippines.”
The remarkable financial bull market in SE Asia is part of what is leading the emerging markets from the doldrums of the late financial crisis. Since global stock market strength is also an important precursor to economic strength, it’s time we took a closer look at what the Asian markets generally – and the SE economies in particular – are seeing ahead in terms of economic recovery.
The Emerging Markets ETF is a good reflection of the global emerging markets and is heavily weighted with Asian countries. It’s also a reliable leading indicator for the S&P 500 Index. Its latest breakout to new highs today bodes well for the U.S. outlook going forward with the 4-year cycle bottom only a few days away.
China’s growth rate since the 2008 financial crisis has stolen much of the headlines in spite of the stellar performance of Thailand. The China ETF (FXI) is reflecting the growing momentum of China’s financial sector and on Friday, Sept. 24, recorded its highest close since the early April market peak. FXI is another important leading indicator for the U.S. market; contrary to what many pundits proclaim, what bodes well for China does in fact bode well for the U.S., both in terms of the financial sector as well as the economy.
Industrial production in developed countries collapsed during the 2008 financial crisis. When the U.S. manufacturing sector bottomed out in June 2009, output was nearly 15% lower than in January 2008. Japan, Brazil and the EU experienced even bigger declines. And while manufacturing growth slowed in China and India during the crisis, the industrial output from these two countries never fell below the January 2008 level. Industrial production in the U.S., Europe and Japan have yet to recovery to their pre-crisis levels while production in China and India have since gone on to record higher levels of output. According to The Economist, China’s and India’s industrial production rate is currently about 14 percent compared with only about 8 percent for the U.S. Thailand’s production rate is 16 percent. Thus the Asian tigers continue to lead the global economic recovery.
Turning our attention to the U.S., despite the pervasive atmosphere of doom and gloom over the domestic outlook, three out of four of the most important leading economic indicators are pointing to an improved outlook in the months ahead. Let’s start with perhaps the most important one, namely bank credit. The following chart courtesy of the St. Louis Federal Reserve shows that for the first time since the credit crisis, bank credit growth has gone from negative to positive on a percentage change basis. The bank credit growth trend line has crossed above the “zero” line in recent weeks and is making a series of higher highs and lows – the first important step in the reversal of the declining bank credit trend from 2007.
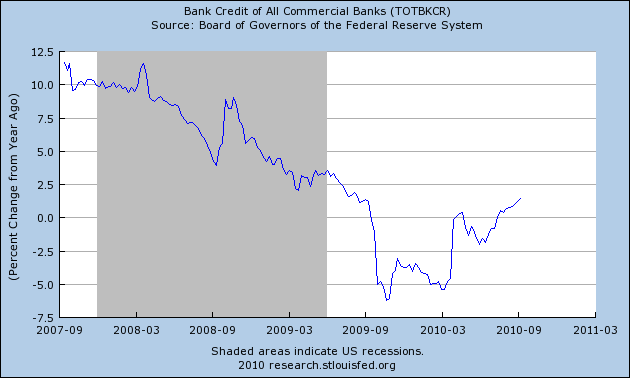
This emerging trend bodes well for the important cyclical period we’re about to enter. With the 4-year cycle now bottoming and the 6-year cycle peaking later next year, the period between fourth quarter 2010 and fourth quarter 2011 holds forth the potential to be one of additional recovery in both the financial market and the economy. We’ll be discussing the possibilities attendant with this positive cyclical configuration in future reports.
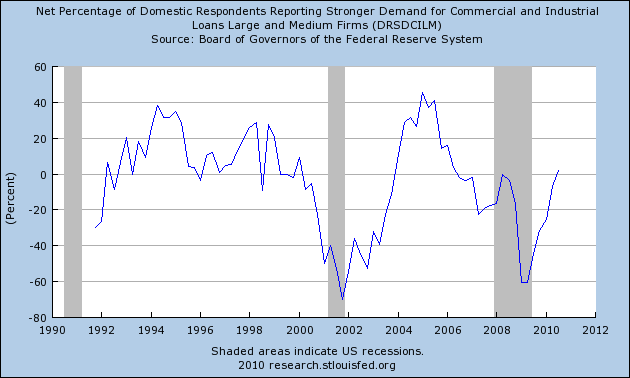
Next is the chart showing the demand for commercial and industrial loans among large and medium size U.S. companies. This is an important indicator and is often a precursor to economic strength or weakness, depending on the direction of the trend. As with the bank credit chart, the commercial loan demand trend has just barely risen above the “zero” line and is back into positive territory for the first time since falling under it in 2006 prior to the credit crisis. This is another important sign of recovery being afoot. The pessimists have suggested that loan demand has been weak to non-existent but this chart belies that assertion.
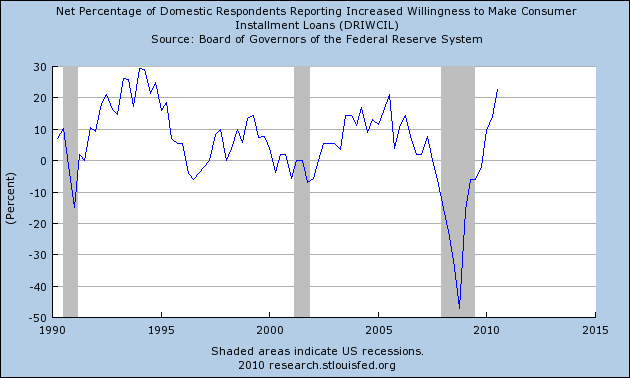
Next is the chart showing the willingness of lenders to make consumer installment loans. This is another important economic indicator and as you can see trend has bounced back sharply in V-shaped fashion since the bottom in mid-2009. This particular trend is now at its highest level in percentage terms in several years.
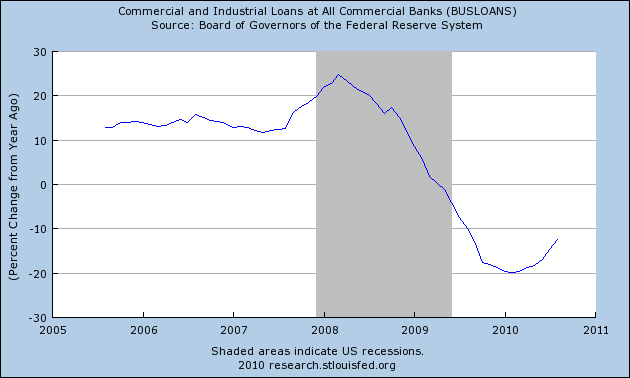
Lastly we turn to the graph depicting the commercial and industrial loans of all commercial banks. As you can see, this is the only one of the charts in the series that hasn’t yet entered into positive territory since the credit crisis decline. It is showing signs of bottoming, however, and has turned up since earlier this year.
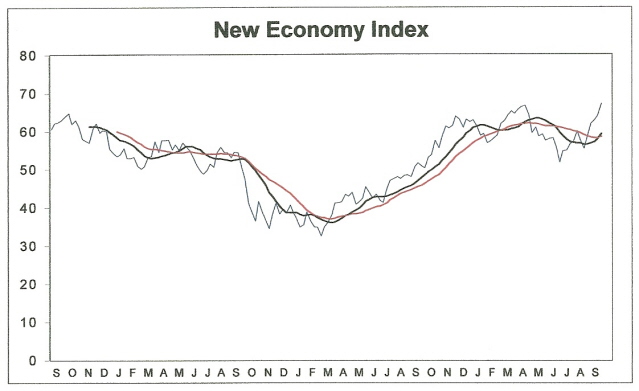
All in all, the monetary trends are shaping up nicely and are pointing toward additional recovery heading into 2011. Another important indicator of domestic economic strength on the retail level is the New Economy Index (NEI), an average of the prices of five very important stocks which heavily reflect the U.S. business outlook. The NEI was created back in 2007 under the assumption that “as goes the stock market (particularly for these five stocks), so goes the economy).”
As you can see in the following graph, NEI has just made a fresh new 3-year high while the 12-week moving average has once again crossed above the 20-week moving average – a signal that confirms the domestic retail economy is strengthening. The direction of the NEI is pointing to further economic improvement in the coming months, even though it may be hard to believe it based on the miasma of negative news and overall pessimism over the state of the economy. NEI is telling us to look for an improvement in the economic numbers in the foreseeable future and although it can’t predict the magnitude of the improvement, it’s sending an emphatically positive signal that at least some improvement is on the way.
Silver Trading Techniques
With the precious metals long-term bull market well underway, many independent traders and investors are looking for ways to capitalize on short-term and interim moves in the metals. Realizing that the long-term “buy and hold” approach isn’t always the best, many are seeking a more disciplined, technical approach for realizing gains in the market for metals and the PM mining shares.
It’s for that reason that I wrote “Silver Trading Techniques” back in 2005. My goal in writing this book was to provide traders with some reliable trading indicators for anticipating and capturing meaningful moves in the price for silver and the silver mining shares. Included in this guide are rules for using the best moving averages when trading silver stocks, how to spot a turnaround in the silver stocks before it happens (best-kept secret!), how to tell when a silver stock has topped and which moving average crossovers work and which don't . Also explained are the best technical indicators for capturing profitable swings in silver and silver stocks and how to apply them.
You won't find these techniques in a copy of Edward's & Magee's book on technical analysis or anywhere else. These reliable "tricks of the trade" are available to you in Silver Trading Techniques. Click here to order:
http://www.clifdroke.com/books/silvertrading.mgi
All orders for the book will also receive a FREE copy of the recently published, “Gold Stock Trading Techniques,” which contains reliable strategies for short-term technical trading in the gold mining shares with an emphasis on safety and capital preservation.
By Clif Droke
www.clifdroke.com
Clif Droke is the editor of the daily Gold & Silver Stock Report. Published daily since 2002, the report provides forecasts and analysis of the leading gold, silver, uranium and energy stocks from a short-term technical standpoint. He is also the author of numerous books, including 'How to Read Chart Patterns for Greater Profits.' For more information visit www.clifdroke.com
Clif Droke Archive |
© 2005-2022 http://www.MarketOracle.co.uk - The Market Oracle is a FREE Daily Financial Markets Analysis & Forecasting online publication.