


Flight From Safety of U.S. Treasury Bonds into Stocks?
Stock-Markets / Financial Markets 2010 Oct 23, 2010 - 09:00 AM GMTBy: Steven_Vincent

 Although the current market dialogue between Bulls and Bears is focused on the Inflation vs. Deflation dichotomy, it's possible that a dynamic between Risk vs. Safety is the better framework for analysis.
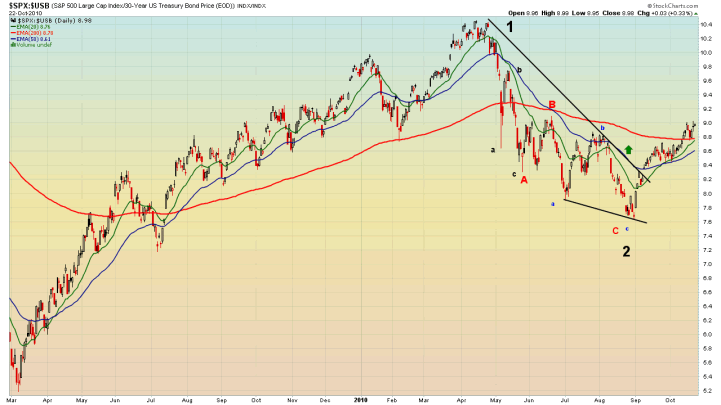
The possible transition from Safety to Risk took a big leap forward recently as the most favored repository of investor fears, the US Treasury market, showed significant signs of breaking down and putting in a long term top. SPX:USB, the ratio of Risk to Safety as measured by the S&P 500 / US Treasury 30 Year Bond price, closed well above its 200 day EMA after having broken out of a declining wedge pattern. After the breakout the EMA was successfully retested:
This came even as market participants were given cause for renewed alarm as all 50 States Attorney Generals sued the major banks for mortgage load fraud. It also came as Ben Bernanke (along with other key policy makers) raised doubts about the size and scope of any future monetary easing. Many markets--precious metals in particular-- owe recent gains almost exclusively to the anticipation of substantial future monetary and price inflation. There is cause to believe that that assumption may be at least partially disappointed at the November 3rd Federal Reserve meeting.
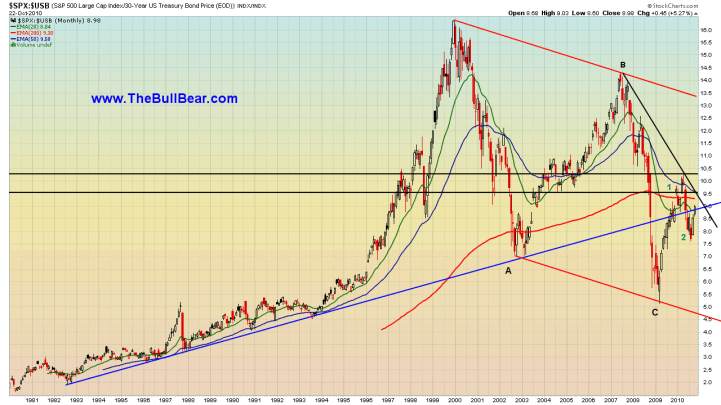
The long term monthly chart of this ratio also shows that as the 200 day EMA was taken out, the long term uptrend was recaptured.
The daily chart of the long bond ETF, TLT, shows that a Wave iii of 3 decline may have begun.
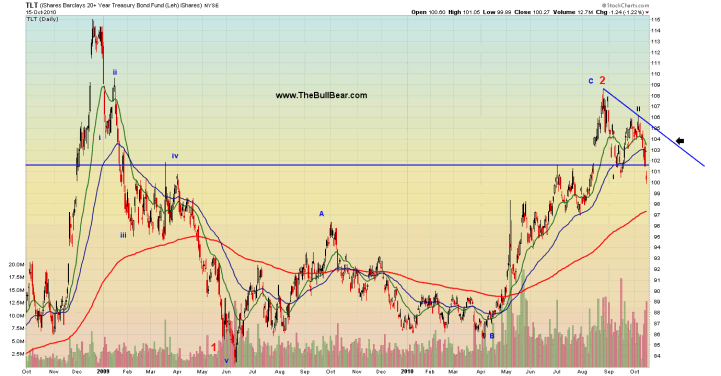
It's possible that market conditions may converge to cause a final retest of the key 104 level, setting up a (iii) of iii of 3 decline making any such move an ideal shorting opportunity. The drop from there could be fast and dramatic as bond holders decide that there is potential downside risk in bonds and opportunity cost in staying out of risk assets like equities.
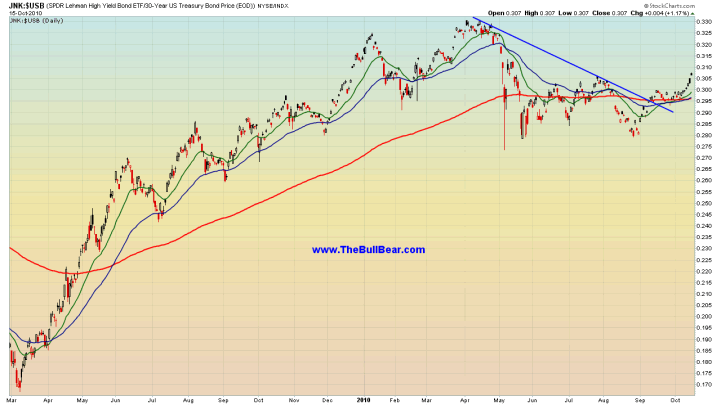
Another ratio of Risk to Safety, the Junk Bond ETF to the US Treasury 30 Year Bond (JNK:$USB), is also showing some very bullish technical action this week with a 50/200 bullish EMA cross.
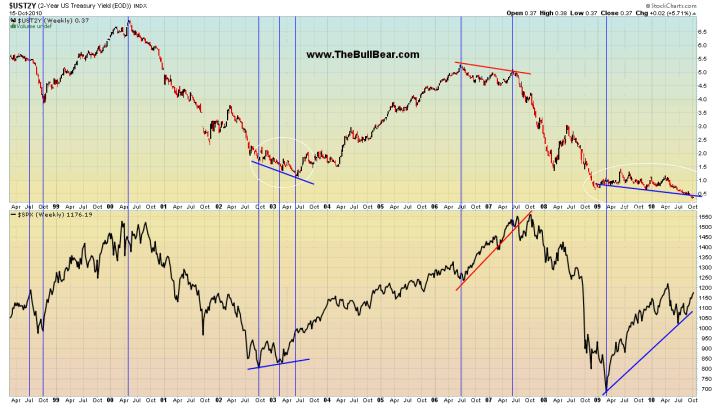
On the short end of the yield curve, the 2 Year Treasury is showing signs of bottoming out. In 2003 the next leg up in the stock market was signaled by a breakout in this market. Traders should keep their eyes here for confirmation that a big move of parked funds from safety to risk is underway.
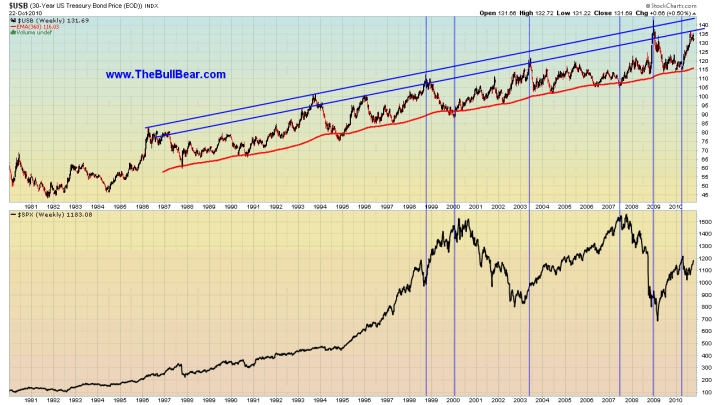
The long term chart of the 30 Year Treasury Bond price shows that in late August it once again reached the upper rail of its long term trend channel. In every prior case this market has sold back down to its long term 360 week EMA.
In the short term, the Treasuries market may be the beneficiary of flight to safety as doubt about QE2 and fears of a mortgage related banking crash grow. In my opinion at this time if this were to occur it would probably represent a great setup for a long term shorting opportunity.
Generally these reports as well as twice weekly video reports are prepared for BullBear Trading Service members and then released to the general public on a time delayed basis. To get immediate access just become a member. It's easy and currently free of charge.

Disclosure: No current positions.
By Steve Vincent
Steven Vincent has been studying and trading the markets since 1998 and is a member of the Market Technicians Association. He is proprietor of BullBear Trading which provides market analysis, timing and guidance to subscribers. He focuses intermediate to long term swing trading. When he is not charting and analyzing the markets he teaches yoga and meditation in Los Angeles.
© 2010 Copyright Steven Vincent - All Rights Reserved Disclaimer: The above is a matter of opinion provided for general information purposes only and is not intended as investment advice. Information and analysis above are derived from sources and utilising methods believed to be reliable, but we cannot accept responsibility for any losses you may incur as a result of this analysis. Individuals should consult with their personal financial advisors.
© 2005-2022 http://www.MarketOracle.co.uk - The Market Oracle is a FREE Daily Financial Markets Analysis & Forecasting online publication.