


Gold’s Performance Continues to Lag the Global Stock Markets
Commodities / Gold and Silver 2010 Oct 27, 2010 - 04:59 AM GMTBy: Lorimer_Wilson

 Nu Yu writes: Gold and silver have had a sharp move downward in response to China’s first interest rate hike last week while the stock market continues to move forward begging the question:
“Is gold decoupling from the stock market?”
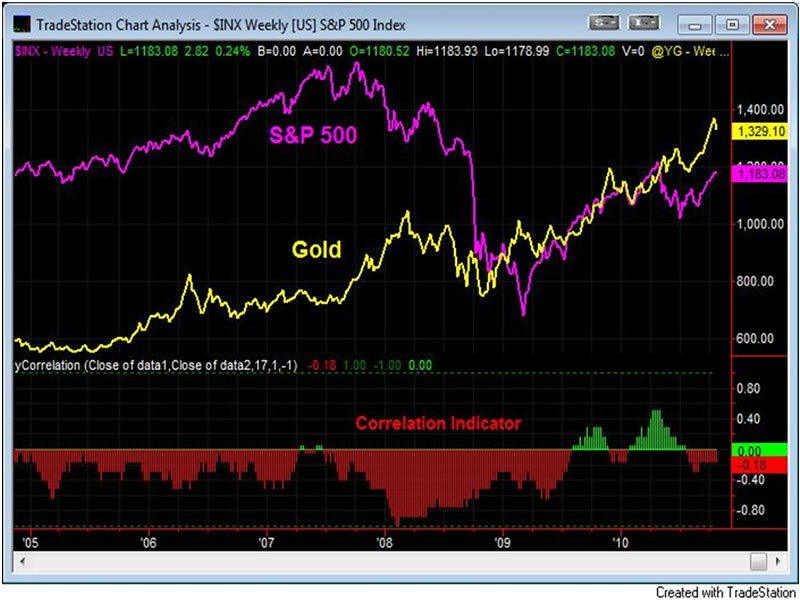
By using a correlation indicator calibrated for the intermediate-term, the chart below shows the change in coupling between gold and the S&P 500 index during the past six years. The value of the correlation indicator lies between 1 and -1 whereby:
a) If the correlation value is 1 it indicates a perfect positive coupling between gold and the S&P 500 index which means gold and the stock market move in the same direction regardless of whether they go up or down.
b) If the correlation value is -1, it indicates a perfect negative coupling with gold and the stock market moving in opposite directions.
c) If the correlation value is 0, there is no coupling at all between them.
Recent Correlation History of Gold to American Stock Market
1. Before June of 2009, the correlation value had stayed in the negative region for quite a long time with gold and the S&P 500 index moving more or less against each other due to their negative coupling.
2. From June of 2009 until recently the correlation value moved into the positive region, and both gold and the stock market abnormally moved in the nearly same direction.
3. Since the beginning of July of 2010, however, right after the S&P index made the year’s low, the coupling between the two has been dramatically reduced and the correlation has moved back into the negative region.
Editor’s Note: Don’t forget to sign up for our FREE weekly “Top 100 Stock Market, Asset Ratio & Economic Indicators in Review”
The recent very low negative correlation value of around -0.2 (very close to 0) indicates that gold and the stock market are decoupling. It means that gold may or not go up as the stock market keeps rally, or the stock market may or may not go down if gold declines. That is the exact market behavior we saw last week. Therefore, China’s rate hike and the decoupling process of gold and the S&P 500 index suggest that gold and silver may not join the party if the Chinese stock market and the U.S. stock market advance in 2011.
Broad Stock Market Continues Rally with Weakening Momentum
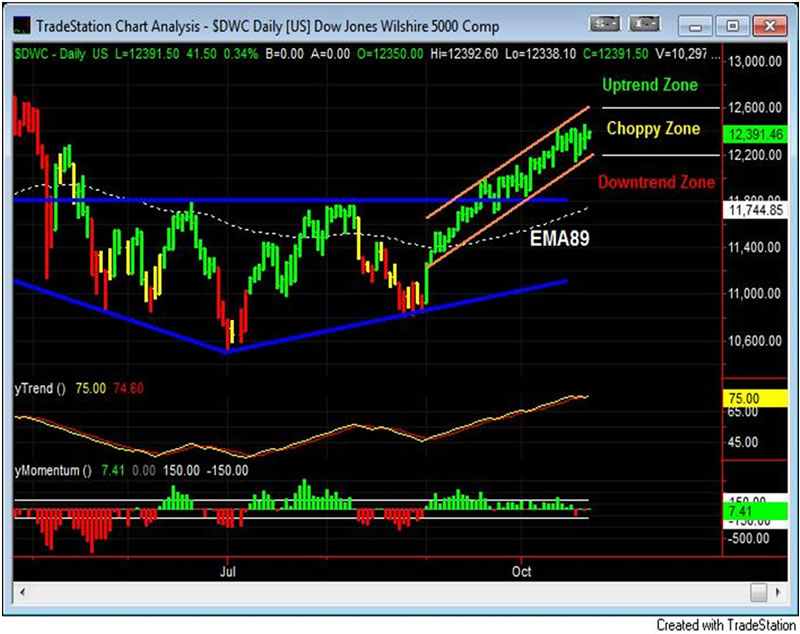
The Dow Jones Wilshire 5000 index, as an average or a benchmark of the total equity market, continues the rally that has been led by the internet and the basic materials sectors since September 1. In the short-term scale, the Wilshire 5000 index (see chart below) has established a 7-week uptrend channel (orange lines). The 6-month Inverted Roof or Complex Head-and-Shoulders Bottom pattern (blue lines) suggests there would be potentially another 4% upside measured move from the present price to the target price of 13000.
The Leading Wave Index (LWX) indicator, color coded into the price bars of the chart below for easy reference, has been bullish since September 1 and looks like it will extend into early November although the forecast of the LWX indicator shows that the bearish time-window may begin as soon as early November supported by my momentum indicator which shows weakening signs in the current rally. As such, it gives us another puzzle: will we once again experience the traditional best 3-month span of November, December, and January again, or will we have something else this time?
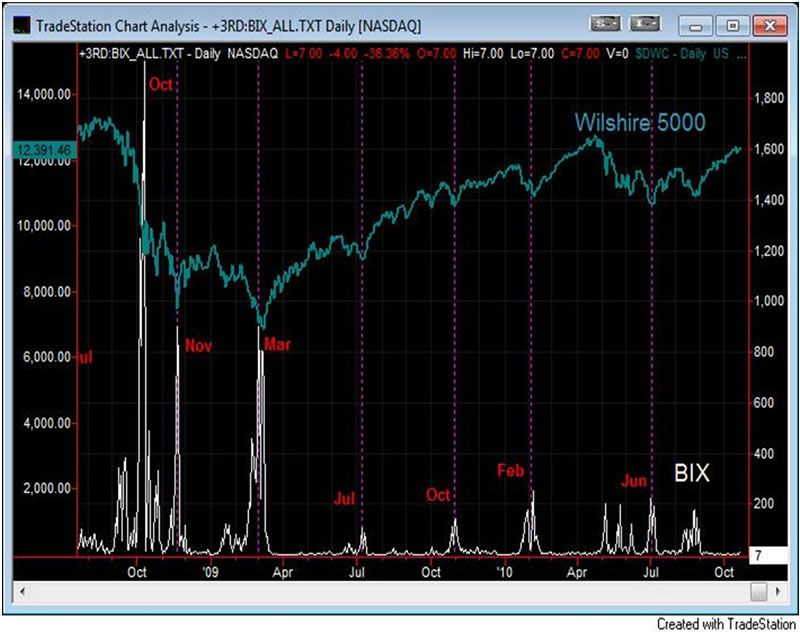
The Broad Market Volatility is Below the Panic Threshold
The Broad Market Volatility (BIX), measured from over 8000 U.S. stocks, closed at 7 last Friday and it is very much below the panic threshold level of 47. Although the volatility has had a slight increase, the volatility level of 7 is low and it indicates that the current market is bullish. The BIX is plotted in the following chart as compared with the Wilshire 5000 index.
China’s Shanghai Stock Market Index Reaches Target of 3000
The following chart is a weekly chart of China’s Shanghai Stock Exchange Composite Index (SSECI). A bullish Golden Cross, defined by a successful breaking through both the 17-week moving average (equivalent to the 89-day moving average) and the median line of the 14-month downtrend channel around 2650, gives a sign of starting a new bull market. The SSECI had a 12% explosive surge after the golden cross and has reached the first target of 3000 at the upper border of the 14-month downtrend channel. The 14-month downtrend line may not have enough strength to resist this fierce advance. Last week China’s central bank announced the first increase of its key interest rate since 2007 and, contrary to conventional thinking, I see China’s rate move as a very bullish sign for the Chinese stock market.
Conclusion
From the charts above it seems most likely that:
The American and Chinese stock markets will continue to outperform gold in the near termDr. Nu Yu (fx5186.wordpress.com/), co-founder and president of Numarkan Investments and an affiliate of the Market Technician Association, is a frequent contributor to www.munKNEE.com
Visit http://www.FinancialArticleSummariesToday.com, “A site/sight for sore eyes and inquisitive minds”, and www.munKNEE.com, “It’s all about MONEY”, where you can sign up for their FREE weekly "Top 100 Stock Market, Asset Ratio & Economic Indicators in Review."
© 2010 Copyright Dr. Nu Yu - All Rights Reserved
Disclaimer: The above is a matter of opinion provided for general information purposes only and is not intended as investment advice. Information and analysis above are derived from sources and utilising methods believed to be reliable, but we cannot accept responsibility for any losses you may incur as a result of this analysis. Individuals should consult with their personal financial advisors.
© 2005-2022 http://www.MarketOracle.co.uk - The Market Oracle is a FREE Daily Financial Markets Analysis & Forecasting online publication.