


Stocks Longterm Bull Market, Elliott Wave Weekend Analysis 31st October
Stock-Markets / Elliott Wave Theory Oct 31, 2010 - 11:55 AM GMTBy: Tony_Caldaro

 For the first time in quite a while positive weekly economic reports outweighed negative reports by over three to one. The market responded, before the reports, with a new uptrend high and then went sideways during the reports. On the negative side. We had a lower rise in the Case-Shiller index, a decline in the UofM consumer sentiment and the M1 multiplier. On the postive side. Existing/new homes sales rose as did the FHFA price index and weekly mortgage applications. Q3 GDP rose, along with durable goods orders, the Chicago PMI and consumer confidence.
Weekly jobless claims declined and the WLEI continued to move higher. The stock market, however, remained in a trading range. The SPX/DOW were -0.05%, and the NDX/NAZ were +1.05%. Asian markets lost 0.9%, European markets lost 0.7%, the Commodity equity group gained 0.2%, and the DJ World index was flat. Bonds were -0.1%, Crude lost 0.3%, Gold gained 2.3%, and the USD was -0.6%. Next week will be highlighted by tuesday elections, the FOMC statement on wednesday, and the Payrolls report on friday. Best to your week!
LONG TERM: bull market
While the medium term trend remains up and the short term continues its sideways with a upward bias movement, we continue to step back and look at the bigger picture again this week. Last week we covered the US and various foreign markets, illustrating how their bullish wave patterns look quite similar:Global Stock Markets Weekend Elliott Wave Analysis Update. This week we will view the US stock market from a time cycles perspective.
The time cycles we follow occur on a regular basis and last from two to thirty-four years. They are typically measured from bottom to bottom. This determines the length of the cycle. After a bottom a cycle will exert upside momentum on the stock market, and then downside pressure after they top. The most commonly known time cycle, in the US, is the 4 year Presidential cycle. We first wrote about this cycle back in mid-2006, when it was bottoming. The chart below displays the effect of a 4 year cycle bottom going back to 1980. This cycle has been operative since 1934. Observe how it usually bottoms at important stock market lows, i.e. 1982, 1990, 1994, 1998 and 2002. The two other times, 1986 and 2006, the cycle low occurred more than a year before the stock market hit an important high. We wrote about its upcoming low in May 2010: http://caldaro.wordpress.com/2010/05/24/the-4-year-cycle/. The four year Presidential cycle bottomed in July 2010.
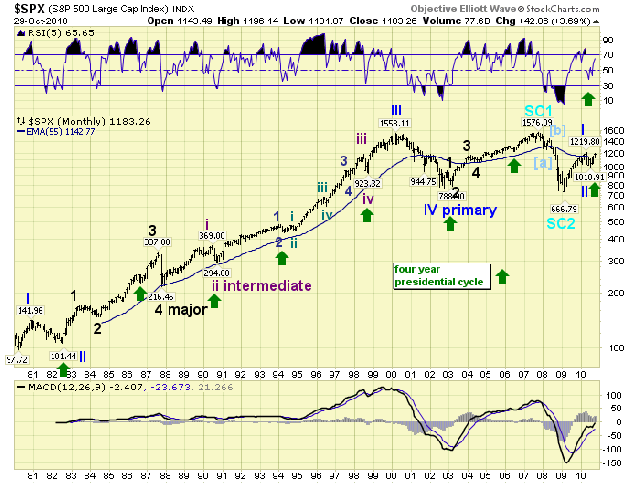
The next two time cycles we will examine are two we found using OEW analysis. The first one is the 34 year Secular cycle. This time cycle is similarly aligned with the 34 year commodity cycle, which we have discussed from time to time since we uncovered that one. This cycle has been quite regular since the 1949 stock market low. It rises for about 18 years and then declines for about 16 years. Please observe on the chart below the secular bull markets: 1949-1967 and 1982-2000. Then the secular bear markets: 1929-1949, 1967-1982 and 2000-2016 est. This cycle suggests we have been in a secular bear market since the year 2000 which should last until around 2016. So why are we bullish?
Secular bear markets are about 16 years in duration and exhibit a pattern within the down cycle. First, the stock market makes an important peak about 6 – 8 years into the cycle: 1937, 1973 and 2007. Second, the stock market then makes an important low about 6 – 8 years before the cycle ends: 1942, 1974 and 2009. This low is never revisited again as the market starts working its way higher/sideways until the cycle ends. March 2009 was the stock market price low for the 34 year Secular cycle.
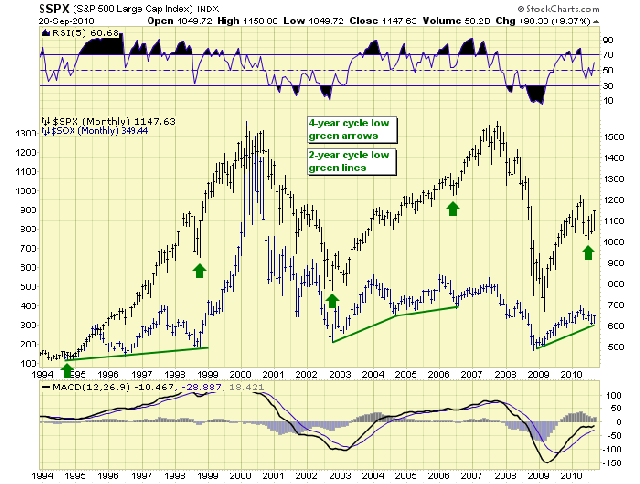
The third cycle we will review is the two year Tech Product cycle. This cycle is based on technology and we use the SOX (semiconductor) index to track it. We reported on this cycle recently in a special report: the SPX with Sox: http://caldaro.wordpress.com/2010/09/15/the-spx-with-sox/. The chart below displays how the 2 year tech product cycle works in conjuction with the 4 year presidential cycle. Observe the regular two year cycle lows in 1994, 1996 and 1998. Then again in 2002, 2004 and 2006. The 2 year cycle low in 2000 created a bounce for only two months during the dotcom meltdown. Now notice the low in 2008 and the recent low in August 2010. Every two year cycle low has led to a surge in the stock market lasting for more than one year.
In summary, we are in the bearish part of the 34 year secular cycle but the actual price low already occurred in March 2009. Currently there is an upward bias lasting until around 2012/2013. With the 4 year presidential cycle bottoming in July 2010, and the 2 year tech product cycle bottoming in August 2010. There is additional upside momentum from both of these cycles as well. We continue to be bullish into at least 2012.
MEDIUM TERM: uptrend new high at SPX 1196
The uptrend that started at the early July low at SPX 1011 has run into some resistance here at the OEW 1187 pivot. We have been counting this uptrend as Major wave 1 of Primary wave III of this five Primary wave bull market. As you can observe from the chart below we have counted this bull market as having completed Primary wave I in April 2010 at SPX 1220, after it completed five Major waves up from the March 2009 at SPX 1011 low. Then the market declined about 17% into the July SPX 1011 low, ending Primary wave II.
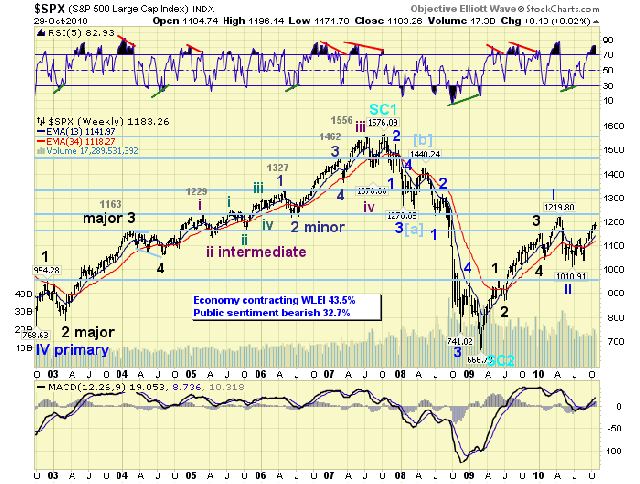
During this uptrend Major wave 1 has been subdividing into five Intermediate waves. Intermediate wave one ended at SPX 1129 in early August. This was followed by Intermediate wave two at SPX 1040 into the end of August. Intermediate wave three hit a new high at this week at SPX 1196.
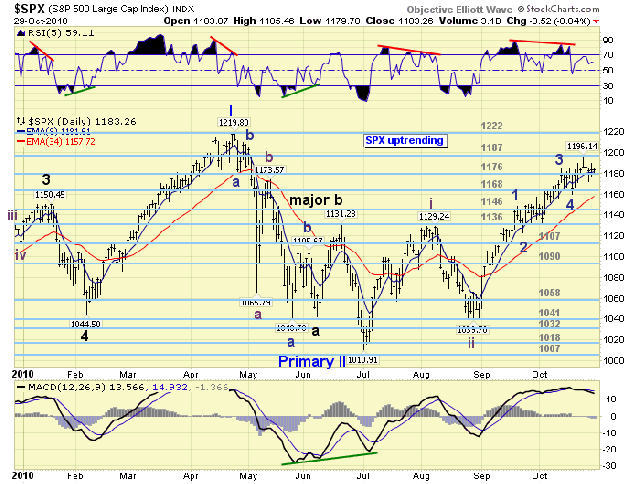
As you will have observed, we are also counting the internal structure of Intermediate wave three with five Minor waves. The recent high at SPX 1196 is sufficent to meet the minimum required for the completion of Intermediate wave three. However, we are expecting something closer to the OEW 1222 pivot, which ended Primary wave I. After we do get a pullback for Intermediate wave four, which should find support between the OEW 1136 and 1168 pivots. Then Intermediate wave five should be underway until around January 2011.
SHORT TERM
Support for the SPX remains at 1176 and then 1168, with resistance at 1187 and then 1222. Short term momentum ended the week at neutral. For the past three weeks, when the SPX hit 1184 this market has struggled to break through and hold the OEW 1187 pivot. We had a momentary breakthrough early monday but it failed to hold. During this three week period the market has experienced four pullbacks, between 17 and 26 points, after each new marginal uptrend high. These types of pullbacks have been quite normal during Intermediate wave three. As a result of this choppiness we are maintaining three short term counts: two on the SPX hourly and one on the DOW hourly. Use the link below to access those charts.
When observing the technicals we find some weakness in the daily MACD, and a negative divergence in the daily RSI. On a weekly basis, the RSI is starting to display an overbought condition for this uptrend. The financial sector is also showing some weakness with the XLF already in a downtrend. The KBE (major banks) and KRE (regional banks) have been weakening as well. All other eight sectors, of the SPX’s nine sectors, look fine.
With the tuesday election and the wednesday FOMC statement, we should get a resolution to the short term count this week. A close above the OEW 1187 pivot should clear the way for higher prices short term. A break below the OEW 1176 pivot range would likely indicate this uptrend has entered Intermediate wave four. Best to your trading!
FOREIGN MARKETS
Asian markets were mixed on the week for a net loss of 0.9%. All indices are in uptrends but India’s BSE and Japan’s NIKK are displaying some weakness.
European markets were all lower on the week for a net loss of 0.7%. All indices are in uptrends.
The Commodity equity group were mostly higher for a net gain of 0.2%. All in uptrends.
The DJ World index was flat on the week and remains in an uptrend.
COMMODITIES
Bonds lost 0.1% on the week. It still looks like Bond rates are trying to confirm an uptrend.
Crude declined 0.3% on the week and remains in an uptrend.
Gold reversed last week’s decline and gained 2.3%. Resumption of its uptrend underway. Still targeting a minimum of between $1389 and $1411 for this uptrend.
The USD lost 0.6% on the week. We had another postive divergence recently that has done nothing but provide a short term rally. Still downtrending.
NEXT WEEK
Busy, busy week ahead. On monday Personal income/spending and the PCE prices at 8:30, then ISM manufacturing and Construction spending at 10:00. Tuesday is election day and the start of the FOMC meeting. On wednesday we have the ADP index, ISM services, Factory orders, Auto sales, and the FED’s FOMC statement. Thursday, weekly Jobless claims, and Q3 Productivity. On friday, the monthly Payrolls report, the Unemployment rate, Pending home sales and Consumer credit. The FED does not have anything else currently scheduled. Best to your weekend and week!
By Tony Caldaro
http://caldaroew.spaces.live.com
After about 40 years of investing in the markets one learns that the markets are constantly changing, not only in price, but in what drives the markets. In the 1960s, the Nifty Fifty were the leaders of the stock market. In the 1970s, stock selection using Technical Analysis was important, as the market stayed with a trading range for the entire decade. In the 1980s, the market finally broke out of it doldrums, as the DOW broke through 1100 in 1982, and launched the greatest bull market on record.
Sharing is an important aspect of a life. Over 100 people have joined our group, from all walks of life, covering twenty three countries across the globe. It's been the most fun I have ever had in the market. Sharing uncommon knowledge, with investors. In hope of aiding them in finding their financial independence.
Copyright © 2010 Tony Caldaro - All Rights Reserved Disclaimer: The above is a matter of opinion provided for general information purposes only and is not intended as investment advice. Information and analysis above are derived from sources and utilising methods believed to be reliable, but we cannot accept responsibility for any losses you may incur as a result of this analysis. Individuals should consult with their personal financial advisors.
© 2005-2022 http://www.MarketOracle.co.uk - The Market Oracle is a FREE Daily Financial Markets Analysis & Forecasting online publication.