Gold and Silver Short Term Forecast - Ending Diagonal Patterns
Commodities / Elliott Wave Theory Oct 11, 2007 - 08:43 PM GMTBy: Dan_Stinson
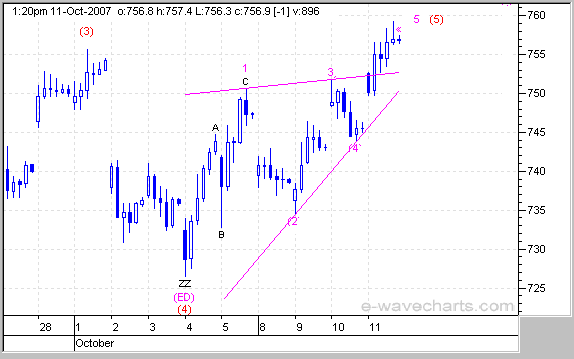
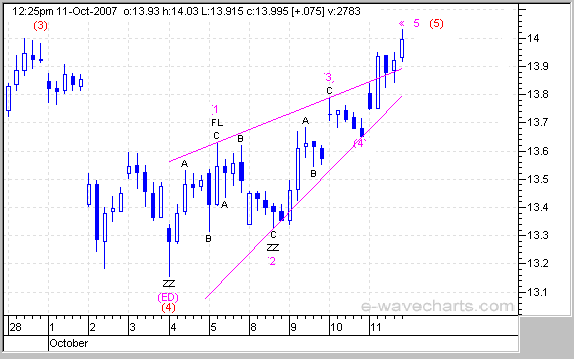
 The price action for Gold and Silver appears as possible ending diagonal patterns, indicating that a sharp pullback is possible. We were also following ending diagonal patterns for the DOW and SPX, which completed on Oct 11th (today). When ending diagonals complete they are followed by a sharp decline to the starting point of the pattern. The starting point is at the wave (4) low on the Gold and Silver charts below.
Ending diagonals are corrective patterns and can extend further and longer but the action should be maintained within the apex of the triangle, until a break below the lower trendline identifies the reversal. The action for the Gold and Silver ending diagonals appear as a throw-over for wave 5 up, and could be complete. A break below the lower trendline will be bearish.
Gold

Silver

We also identified ending diagonal patterns for the markets in Feb 2007 and in July 2007 before the sharp declines into the March and August lows.
These charts are only a guide so that you can follow the action and watch for the expected topping action in the ending diagonal triangle. The action could play out exactly as illustrated or it may need minor adjustments as we follow it through.
If you are interested in viewing these updated charts and other detailed charts with targets on a daily basis, please see the registration details below.
Elliott Wave Chart Site - IntraDay Market Updates on the DOW, Nasdaq, S&P500, Gold, Silver, HUI and the USD.
To learn more on the status of Gold, Silver, HUI and the USD, please visit the link below for registration details.
The commentary and forecasts are updated daily, including intraday commentary and chart updates. Fibonacci pivot dates and cycle analysis are also utilized to forecast reversal dates. Registration Details
By Dan Stinson
http://www.e-wavecharts.com
Copyright© 2001-2007
The indices covered include the NASDAQ, DOW, S&P 500, Nikkei, and DOW Transports. Commodity charts include the CRB Index, Copper, Crude, Gold, Silver, HUI and the XAU (Gold and Silver index) . Additional Elliott Wave charts cover the US Dollar (USD),CAD, Euro, 10 Year Treasury Note Yield (TNX), Nortel, Ballard Power, EBay, Encana (ECA), North American Palladium, Gold Corp, Pan American Silver, Central Fund (CEF), Couer D Alene Mines (CDE), Newmont Mining (NEM), Agnico Eagle Mines (AEM) and Denison Mines.
© 2005-2022 http://www.MarketOracle.co.uk - The Market Oracle is a FREE Daily Financial Markets Analysis & Forecasting online publication.


