


Stock Market Update: Hit With the Ugly Stick
Stock-Markets / US Stock Markets Oct 20, 2007 - 03:21 PM GMTBy: Dominick

No doubt about it, stocks really took a beating this week! Who was thinking as the major indices put in record highs earlier this month that we'd take this kind of a tumble so quickly? Well, members at TTC did!
Even non-members who read this weekly update were told on October 06 that we were looking to position ourselves for a move to develop on the downside. The following week, we sold the exact top, to the tick, and rode the waterfall selloff for a quick 30 points. That move came as the S&P reached the limit for an ending diagonal pattern we'd been following for weeks, which, as the name suggests, is a terminal pattern that indicates exhaustion of the larger trend.
An ending diagonal, in Elliott wave terminology, takes the shape of a wedge and occurs at the end of a move. The waves within the pattern are choppy and overlapping, revealing weakness in the market and, once completed, typically retrace back to their origin. This is why last week's update said, “If you think you saw capitulation this week, you ain't seen nothing yet!”
So, having the correct pattern alone gave us a target well before Friday's close. A retrace to the previous fourth wave put our target at about 1518 in the S&P futures. Obviously, swing traders who got short and waited for the decline were ultimately rewarded, but not without some pain first. And since it's not our habit to take much pain when it can be avoided, we offered analysis that allowed members to trade both sides of the market this week profitably. In fact, this sort of indifference to anything but the correct side of the market is the core of our style, which we call “unbiased.”
For most of the week, the market explored whether to retrace as deep as our target suggested, or to turn higher sooner. This sort of action is ideal for scalpers and short term traders, and we continued buying support and selling resistance throughout. Monday's rally, for example, found support at 1567, one of our proprietary targets that serve as the key numbers to trade.
Repeatedly, the market responded to our 1552 pivot level, though as Tuesday's selloff extended to our Fibonacci measurement target at 1544 into the close, we called for a buy that yielded excellent gains with Wednesday's gap up opening. The chart below makes clear that risking the quick gains as we approached obvious resistance was not something we were willing to do.
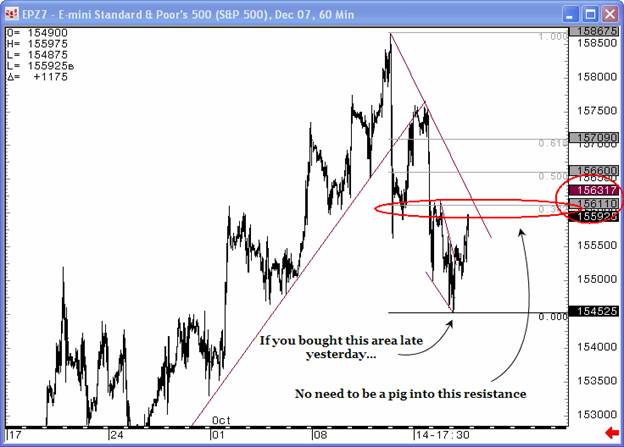
When the market immediately deteriorated, members who'd booked the 15 points of profit saved themselves a lot of pain and frustration. Not only is this shown in the chart below, a few of our other potential support targets are outlined, including what we thought would be the ultimate target for the decline.
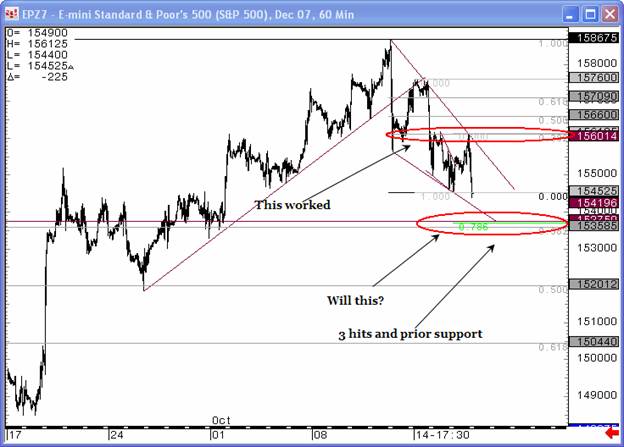
Going into Friday the only things we knew for sure were the market was facing a lot of headwinds. We absolutely don't trade the news, but it's always important to understand the market environment if for no other reason than to understand the psychology of the other participants. Not only was it option expiration week, when the stakes are always higher, but it was also the 20 th anniversary of the 1987 market crash. Tech had been reporting strong earnings all week, but the reaction to the news had been lukewarm given the recent run in the Nasdaq, and narrow. Way more important for us though, was the chart below showing Thursday's close into trendline resistance and eliminating any expectations of a long position.
So, selling was absolutely to be expected, but at the same time we knew the market had to maintain a pattern for the bulls to hold onto. This is partly why we looked to become bullish at about 1520 in the S&P futures. When the bounce off 1522 looked whimpy at best, however, members looking to get long, or had just taken a long position, were advised to stand aside as a bigger game was being played. I really thought we were about to make the low of the day at 1520ish, which it tried, but just couldn't. Perhaps it was the recent change in the uptick rule that allows short selling in a declining market, or maybe it was just the momentum of the decline, but the market ultimately exceeded our target, closing near the lows, and setting up an eerily familiar Monday morning for anyone who remembers October '87.
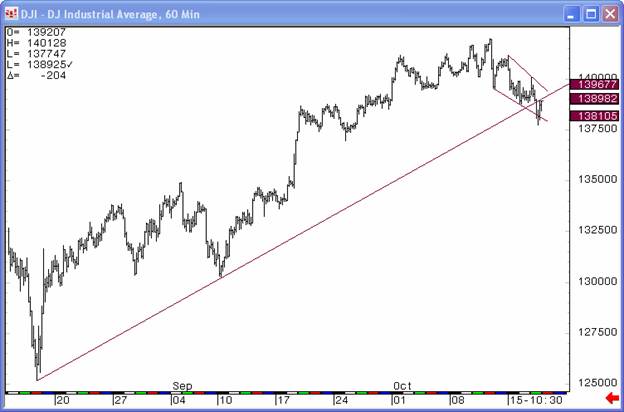
The market got beat with the ugly stick, that's obvious. Stochastics, breadth, RSI … everything looks bad. But, as horrible as things appear, it's really not any worse out there than any of the other bottoms we've bought. Remember August? Remember June? Remember June 2006? Look at a daily chart to get some perspective –as much as traders may have nightmares of twenty years ago this weekend, of a new black Monday to come, the S&P sits a mere 5% from all-time record highs. In other words, Friday wasn't hardly the sort of crash we'll be talking about in 2027, and there's still a very strong chance cooler heads will prevail and make this scary October decline into just another consolidation that ultimately yields to new highs. Afterall, ending diagonals can work in either direction.
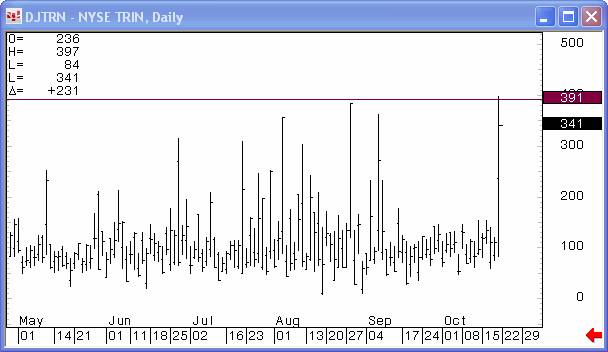
And, if you're like us and need a reason to support looking for at least a bounce next week instead of much more of a decline, there's the TRIN chart below. Although nowhere near the readings that had us pounding the table about a turn in March, a TRIN reading this high bring rallies instead of declines. Two back-to-back readings over 2.5 will get you a long trade
But this is not an invitation to start buying! Since early October we've had three main patterns working and needed the market to help us invalidate and eliminate one or two of them. We needed the market to move to our 1518 target to take out one, but the fact that we got a little extra doesn't take us down to just one because it was not enough to invalidate a second pattern by breaking its major lines. After I review charts this weekend, I may put that pattern to low probability and focus on the other two. Many will remember that I became very bullish at the August lows, after refusing to call a top in July. I think I can see the same setup happening here if certain levels hold. Basically, the pattern that many should have been using would not have produced much upside and wouldn't have been putting in a high much before year end. The other two will produce a much stronger launch once finished and also lock in many of wall streets bonuses as it will still be rallying into year end.
So, if ever there was a time to hold tight and let the market show its hand, this is that time. Members already have the valid counts we're watching, but nonmembers can simply know this: any significantly bearish action next week will have us immediately short the market, though the long term outlook still looks bullish. As Joe has been posting online in the forums and in his weekend updates, it had been looking a lot less likely that the Fed was going to cut again on Halloween until Bernanke's speech on Monday opened the door to more cuts with his concern about a housing spillover into the economy. Even Friday's “uncertainty” speech didn't take further cuts off the table and, with the markets on their knees asking for another accommodation and only seven trading days to go before the next meeting, this is not the time to make big commitments in the S&P.
Instead, do what we always do at TTC when stocks aren't giving us a clear edge – trade other markets! As the television was clamoring about $100 oil this week, we sold it and continue to believe oil will put in a top near recent levels if it hasn't already. Remember, we were also pounding the table, buying at $50 when the talk was about settling back into the 30's. Precious metals have also been a hot trade lately, so be sure to read Joe's Precious Points update for the latest on gold, silver and the Fed.
The point is that the next few days will go a long way towards clearing up the big picture in stocks and while, I don't yet see a massive selloff coming, something of 1987 proportions, anything can still happen. There is still another big move out there between now and year end. In the short term, anything looking like momentum to the downside will have us short, but we do not yet have confirmation of a top once and for all. We've all seen worse days than Friday, but the tape sure is ugly and to keep your account from getting the same way, from taking a serious beating from the ugly stick, our focus in the forum will be to ease back on the trading, look for good setups in other markets, and monitor the major stock indices in realtime as situations develop.
Don't forget to Join now for only $89 a month!
Have a profitable and safe week trading, and remember:
“Unbiased Elliott Wave works!”
By Dominick
For real-time analysis, become a member for only $89
If you've enjoyed this article, signup for Market Updates , our monthly newsletter, and, for more immediate analysis and market reaction, view my work and the charts exchanged between our seasoned traders in TradingtheCharts forum . Continued success has inspired expansion of the “open access to non subscribers” forums, and our Market Advisory members and I have agreed to post our work in these forums periodically. Explore services from Wall Street's best, including Jim Curry, Tim Ords, Glen Neely, Richard Rhodes, Andre Gratian, Bob Carver, Eric Hadik, Chartsedge, Elliott today, Stock Barometer, Harry Boxer, Mike Paulenoff and others. Try them all, subscribe to the ones that suit your style, and accelerate your trading profits! These forums are on the top of the homepage at Trading the Charts. Market analysts are always welcome to contribute to the Forum or newsletter. Email me @ Dominick@tradingthecharts.com if you have any interest.
This update is provided as general information and is not an investment recommendation. TTC accepts no liability whatsoever for any losses resulting from action taken based on the contents of its charts, commentaries, or price data. Securities and commodities markets involve inherent risk and not all positions are suitable for each individual. Check with your licensed financial advisor or broker prior to taking any action.
Dominick Archive |
© 2005-2022 http://www.MarketOracle.co.uk - The Market Oracle is a FREE Daily Financial Markets Analysis & Forecasting online publication.