


Gold and Silver tocks Converging towards a Major Uptrend
Commodities / Gold and Silver 2011 Jan 23, 2011 - 11:12 AM GMTBy: Clive_Maund

 We are now seeing a convergence of indications that a reversal in the Precious Metals sector is at hand that will lead to a major uptrend soon. The last Gold and Silver updates posted on 11th January were bearish over a short to medium-term time horizon and have been proven correct as gold and silver have since fallen substantially, and stocks have taken a real beating. However, in view of the current strongly bullish constellation of indications, it now looks like the downside targets for gold and silver were set too low, although our downside target for stocks has just been hit.
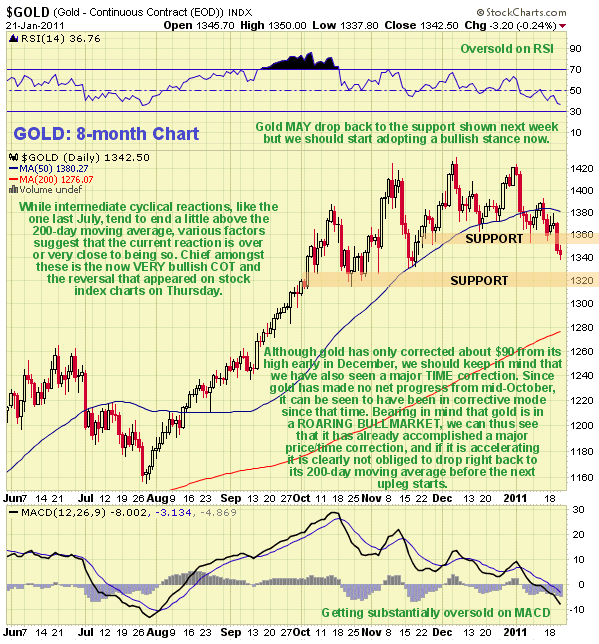
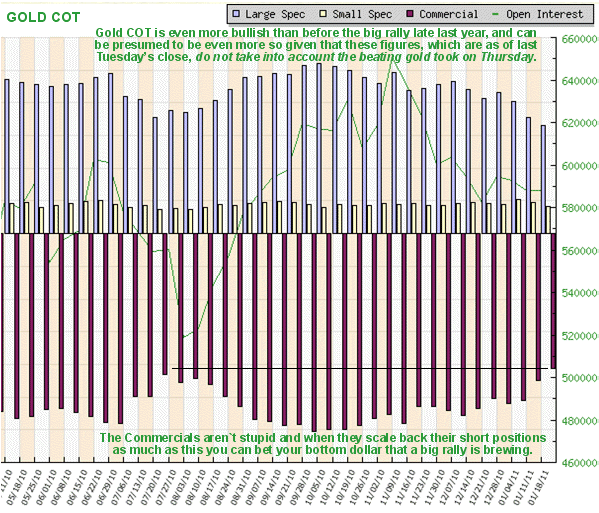
On our 8-month chart for gold we can see how it suddenly broke sharply below the support level at $1360 on Thursday. Normally of course we would expect such a breakdown to lead to further weakness down at least to the next support level in the $1320 area, with possible continuation to the vicinity of the 200-day moving average currently approaching $1280. However, the big news at this time is the latest COT figures which show that the Commercials have scaled back their short positions in gold dramatically - and remember that the latest data is only up to date as of last Tuesday and thus does not factor in Thursday's sharp drop, which will have resulted in even lower readings. The COT chart, posted below the 8-month gold chart to enable you to compare readings at gold's peaks and troughs, is startling and a very strong positive indication for bulls as it shows that the Large Specs (dumb) have scaled back their long positions to levels even lower than they were last July, while the Commercials (smart) have scaled back their short positions to levels even lower than they were last July. This - just by itself - is viewed as sufficient evidence that we are close to another big upleg developing in gold. What about the breakdown below $1360 on Thursday that we had earlier rated as technically significant? - the latest indications, especially the COT figures, strongly suggest that this a "big money" gambit to wrong foot technical traders and they certainly have the clout to do it.
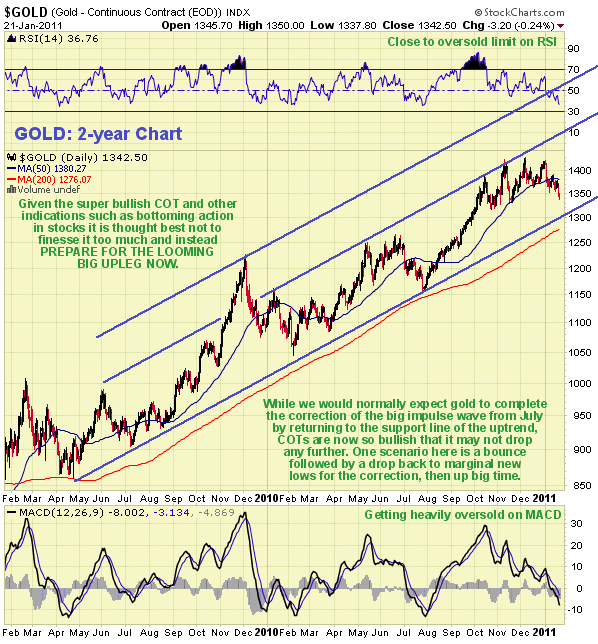
The 2-year chart for gold is interesting as it shows the fine long-term uptrend. On this chart it is readily apparent why it is reasonable to expect gold to complete its corrective phase by dropping down to the lower support line of its trend channel now in the $1305 area, and it could easily do so early next week ahead of options expiry on the 26th (they usually fiddle the price down into options expiry to swindle Call option holders out of their gains, unless the public hold more Puts of course)) - if it does so this will be an opportunity that you should jump on with both feet, but given the super bullish COT structure it may prove wise not to try to finesse it too much, because once the next rally starts it could be a real barnburner due to the horrible predicament the cartel are now in with respect to their massive short positions, especially in silver.
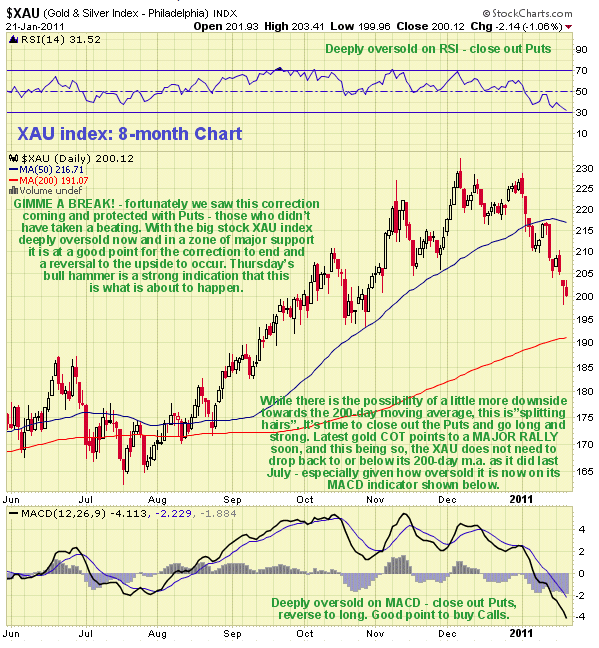
Alright, so what about the other indications that a reversal is at hand? Stocks have already fallen to hit our downside target given in the last update for the HUI index and have taken a real hammering, given the relatively modest drop in gold and silver at the same time. Now take a look at the latest 8-month chart for the XAU large PM stock index. This year it has suffered its deepest, steepest drop for a long time, which has resulted in it becoming deeply oversold at a point not very far above its rising 200-day moving average. So it is interesting to observe that a bull hammer formed on Thursday when gold and silver fell heavily. This type of candlestick coming after a sizeable downtrend is frequently an indication that it has run its course and this being so Friday's drop back down towards the low of Thursday's hammer is viewed as providing an opportunity to pick up big gold and silver stocks, and Call options in same, at knockdown prices ahead of the next uptrend.
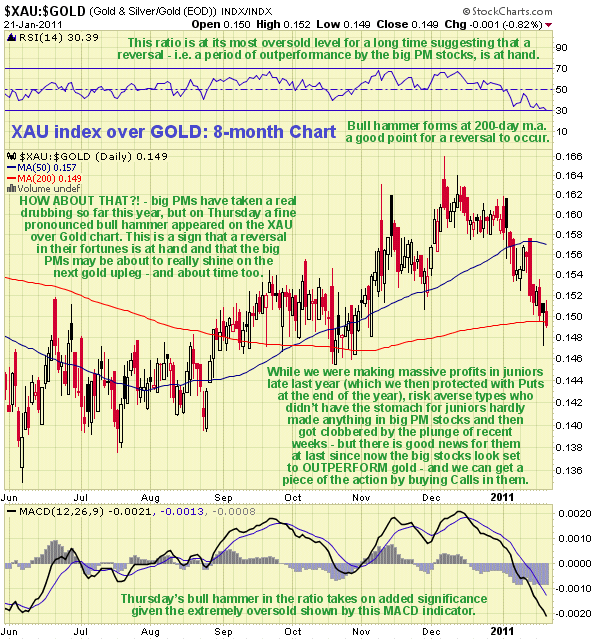
Just how oversold large PM stocks are relative to gold is amply illustrated by the chart for the XAU index divided by gold where we see the RSI indicator at a critically oversold extreme and the MACD indicator almost dropping off the scale for this 8-month timeframe. Thus it is interesting to observe that an even more pronounced bull hammer formed on Thursday than occurred in the XAU index itself at the 200-day moving average for this ratio. Other things being equal this suggests that it is a good time to arbitrage out of gold and into big gold (and silver) stocks.
Any positions opened to make speculative gains on this drop should now be closed out (for a big profit). There are times in this business when you can "have your cake and eat it", as those who bought Puts or bear ETFs to protect open long positions in stocks as recommended at the end of last year have the opportunity to sell them now for a big profit that covers the stock losses, and then watch with satisfaction as the stocks go on to recoup their losses as the new uptrend takes hold. If you took these steps to protect profits recommended in the article 2010 goes out WITH A BANG - what to expect in 2011 posted on the last day of 2010 you will now be in a strong position.
By Clive Maund
CliveMaund.com
For billing & subscription questions: subscriptions@clivemaund.com
© 2011 Clive Maund - The above represents the opinion and analysis of Mr. Maund, based on data available to him, at the time of writing. Mr. Maunds opinions are his own, and are not a recommendation or an offer to buy or sell securities. No responsibility can be accepted for losses that may result as a consequence of trading on the basis of this analysis.
Mr. Maund is an independent analyst who receives no compensation of any kind from any groups, individuals or corporations mentioned in his reports. As trading and investing in any financial markets may involve serious risk of loss, Mr. Maund recommends that you consult with a qualified investment advisor, one licensed by appropriate regulatory agencies in your legal jurisdiction and do your own due diligence and research when making any kind of a transaction with financial ramifications.
Clive Maund Archive |
© 2005-2022 http://www.MarketOracle.co.uk - The Market Oracle is a FREE Daily Financial Markets Analysis & Forecasting online publication.