


Historical Stock Market Analysis Suggests S&P 500 Top at 1400, then Drop to 400!
Stock-Markets / Stocks Bear Market Feb 01, 2011 - 05:47 AM GMTBy: Lorimer_Wilson

 Based on a unique comparison with the Nikkei 225 and prior mega-bears it seems evident that the S&P 500 should continue its rise to 1400 or so in the first half of 2011 before it collapses completely down to an unbelievably low of 400. Before you totally reject this possibility please read the entire article.
Bank of America Merrill Lynch Asia’s Comparison With Nikkei 225
Market strategists Sadiq Currimbhoy, Arik Reiss, and Jacky Tang of Bank of America Merrill Lynch Asia identified a pattern back in 2009 that supports the likelihood of additional gains in the S&P 500 regardless of the extent of the extent of the economic recovery in the U.S.. The analysts plotted the S&P 500 in DXY terms against the Nikkei by rebasing the S&P 500 to the same peak as the Nikkei but lagged by 117 months (i.e. 9.75 years) and uncovered an uncanny relationship as shown in the chart below.
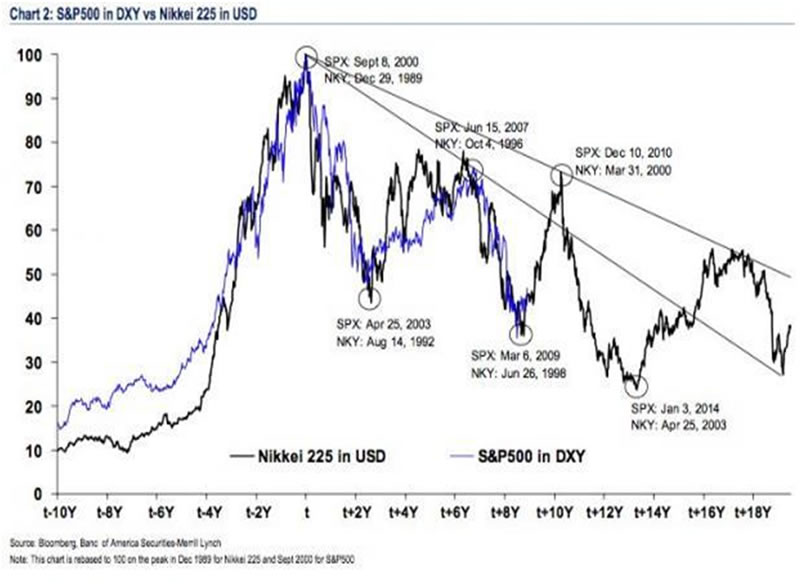
Their analysis suggested that the S&P peak would be achieved by December 10th of last year but that obviously was not the case. Failing to achieve such a precise projection can be excused so the realization of such a target in the first half of 2011 should be deemed acceptable.
Doug Short’s Comparison With Previous Mega-Bears
Doug Short provides an on-going inflation-adjusted overlay analysis (see here and here) at dshort.com of the Dow crash of 1929 and the Nikkei 225 crash from its 1989 bubble high against the current S&P 500 as seen below. It clearly suggests, even without the 9.75 year time-lag as put forth by the Merrill Lynch analysts above, that the S&P 500 is due for a significant correction.
Merrill Lynch’s Historical and Current Peak-Trough Index Comparison
The Merrill Lynch strategists went further, constructing an equally-weighted index of all markets that have crashed more than 45% since 1970 plus the U.S. stock market crash in 1930 and then averaged the recoveries from these crashes (referred to as ‘Historical Peak-Trough Index’). This is shown in the chart below with 25% and 75% bands.
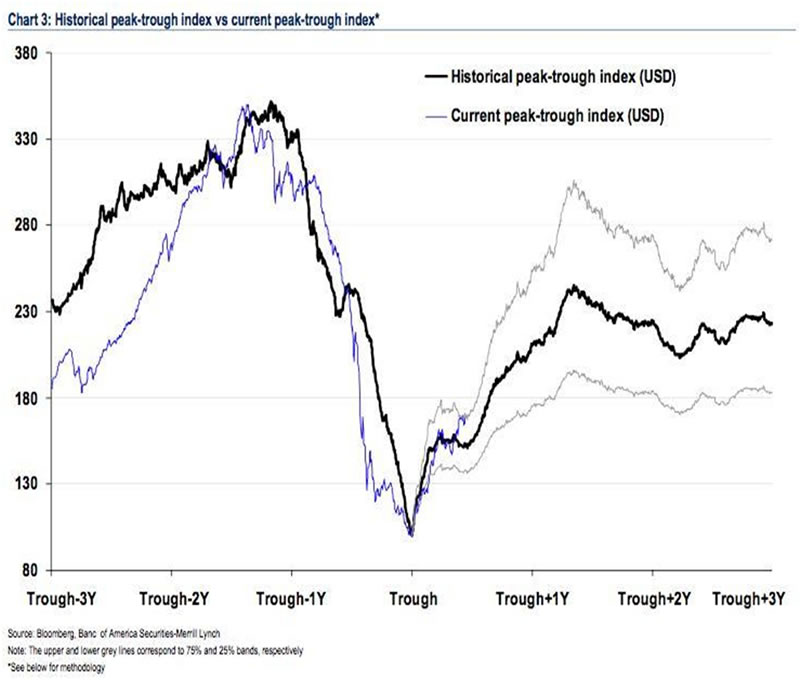
When the Historical Peak-Trough Index was compared to markets that have recently experienced similar deterioration (referred to as ‘Current Peak-Trough Index’) they concluded that the current S&P 500 index looks like it’s following a similar pattern that would have the S&P 500 topping out at somewhere around 1400-1500 (i.e. 5-10% less than the S&P 500’s record high of 1565 in October 2007) before crashing back to its 1994 low of 400 (when the stock market bubble first began) by the end of 2013 or early 2014.
The Merrill Lynch Asia strategists maintained that the rally in the S&P 500 would likely be triggered by central bankers keeping interest rates low (which they have), by an economic recovery (which is slowly underway) and/or by an undervalued U.S. dollar (which has turned out to be the case).
Conclusion
The analysis by Merrill Lynch Asia and the current charting by Mr. Short bear scrutiny and ongoing review if we are to successfully navigate these troubled economic/financial/investment waters.
Lorimer Wilson is Editor of www.FinancialArticleSummariesToday.com (F.A.S.T.) and www.MunKnee.com (Money, Monnee, Munknee!) and an economic analyst and financial writer. He is also a frequent contributor to this site and can be reached at editor@munknee.com."
© 2011 Copyright Lorimer Wilson- All Rights Reserved
Disclaimer: The above is a matter of opinion provided for general information purposes only and is not intended as investment advice. Information and analysis above are derived from sources and utilising methods believed to be reliable, but we cannot accept responsibility for any losses you may incur as a result of this analysis. Individuals should consult with their personal financial advisors.
Lorimer Wilson Archive |
© 2005-2022 http://www.MarketOracle.co.uk - The Market Oracle is a FREE Daily Financial Markets Analysis & Forecasting online publication.