


Very Brutal Stock Market Investor Sentiment
Stock-Markets / Stock Markets 2011 Feb 13, 2011 - 09:39 AM GMTBy: Guy_Lerner

As expected, the bullish extremes in investor sentiment persist. Company insiders continue to unload shares at a high rate. As I have brought forth over the past couple of months, these data points (and those of most analysts) have not mattered as the major indices keep marching higher. It has been very brutal if you are anticipating a correction. It has been brutal if you are short, and it has been brutally hard to sit on your hands and do nothing while you wait for an entry point that is more than 1% below the recent highs. At this point, divining when a meaningful correction will happen is only guess.
For the most part, the indicators have been flashing these kind of extremes since November, 2010. The market did correct (slightly) prior to the initiation of asset purchases by the Federal Reserve. Then from December through January, we got into the "this time is different" scenario where the market goes higher despite the extremes in bullish sentiment. That scenario ended a couple of weeks ago. At this point, price has become disconnected from the indicators. In essence, it has become difficult to quantify the current price action with the data.
With this in mind, I still present this week's data....
The "Dumb Money" indicator (see figure 1) looks for extremes in the data from 4 different groups of investors who historically have been wrong on the market: 1) Investors Intelligence; 2) Market Vane; 3) American Association of Individual Investors; and 4) the put call ratio. The "Dumb Money" indicator is very bullish to an extreme degree.
Figure 1. "Dumb Money"/ weekly
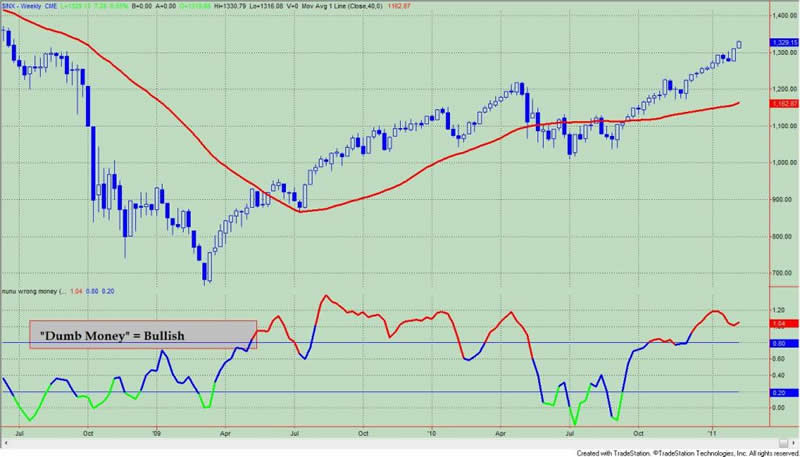
Figure 2 is a weekly chart of the SP500 with the InsiderScore "entire market” value in the lower panel. From the InsiderScore weekly report: "Sellers outnumbered buyers more than 4-to-1 as insider transaction volume increased significantly in the wake of the first major tranche of earnings announcements. While there was a 20% increase in the number of buyers, the number of sellers rose more than 100%, meaning that virtually all of the volume increase was the result of new (or return) sellers. None of this is surprising - sellers have been the dominant breed for twenty-three consecutive weeks, stretching back to the week ended September 7, 2010."
Figure 2. InsiderScore "Entire Market" Value/ weekly
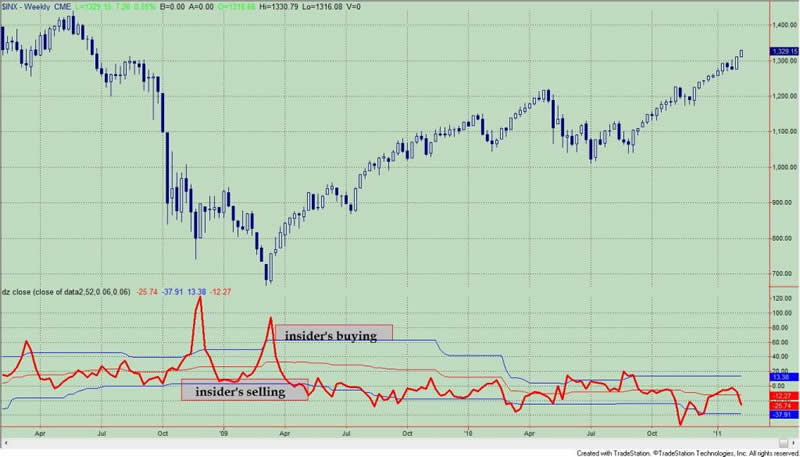
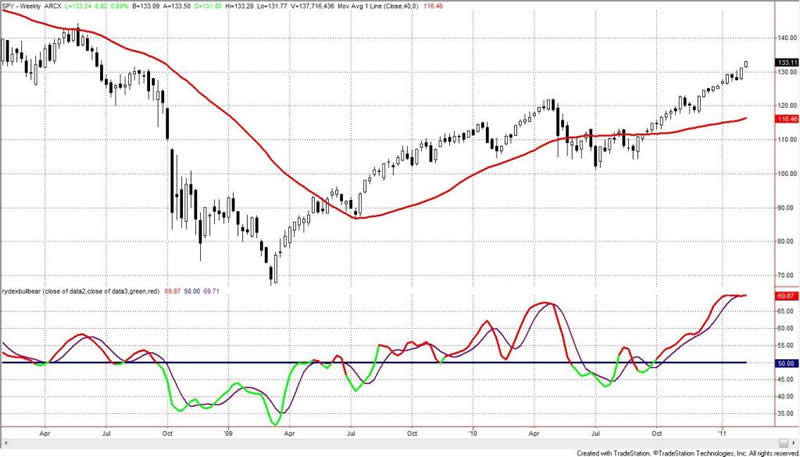
Figure 3 is a weekly chart of the SP500. The indicator in the lower panel measures all the assets in the Rydex bullish oriented equity funds divided by the sum of assets in the bullish oriented equity funds plus the assets in the bearish oriented equity funds. When the indicator is green, the value is low and there is fear in the market; this is where market bottoms are forged. When the indicator is red, there is complacency in the market. There are too many bulls and this is when market advances stall.
Currently, the value of the indicator is 69.87%, and this indicator is at its highest level in 10 years of data. Values less than 50% are associated with market bottoms. Values greater than 58% are associated with market tops.
Figure 3. Rydex Total Bull v. Total Bear/ weekly
To subscribe to Premium Content click here: Subscribe
By Guy Lerner
http://thetechnicaltakedotcom.blogspot.com/
Guy M. Lerner, MD is the founder of ARL Advisers, LLC and managing partner of ARL Investment Partners, L.P. Dr. Lerner utilizes a research driven approach to determine those factors which lead to sustainable moves in the markets. He has developed many proprietary tools and trading models in his quest to outperform. Over the past four years, Lerner has shared his innovative approach with the readers of RealMoney.com and TheStreet.com as a featured columnist. He has been a regular guest on the Money Man Radio Show, DEX-TV, routinely published in the some of the most widely-read financial publications and has been a marquee speaker at financial seminars around the world.
© 2011 Copyright Guy Lerner - All Rights Reserved
Disclaimer: The above is a matter of opinion provided for general information purposes only and is not intended as investment advice. Information and analysis above are derived from sources and utilising methods believed to be reliable, but we cannot accept responsibility for any losses you may incur as a result of this analysis. Individuals should consult with their personal financial advisors.
Guy Lerner Archive |
© 2005-2022 http://www.MarketOracle.co.uk - The Market Oracle is a FREE Daily Financial Markets Analysis & Forecasting online publication.