Most Popular
1. It’s a New Macro, the Gold Market Knows It, But Dead Men Walking Do Not (yet)- Gary_Tanashian
2.Stock Market Presidential Election Cycle Seasonal Trend Analysis - Nadeem_Walayat
3. Bitcoin S&P Pattern - Nadeem_Walayat
4.Nvidia Blow Off Top - Flying High like the Phoenix too Close to the Sun - Nadeem_Walayat
4.U.S. financial market’s “Weimar phase” impact to your fiat and digital assets - Raymond_Matison
5. How to Profit from the Global Warming ClImate Change Mega Death Trend - Part1 - Nadeem_Walayat
7.Bitcoin Gravy Train Trend Forecast 2024 - - Nadeem_Walayat
8.The Bond Trade and Interest Rates - Nadeem_Walayat
9.It’s Easy to Scream Stocks Bubble! - Stephen_McBride
10.Fed’s Next Intertest Rate Move might not align with popular consensus - Richard_Mills
Last 7 days
Stocks Correct into Bitcoin Happy Thanks Halving - Earnings Season Buying Opps - 4th July 24
24 Hours Until Clown Rishi Sunak is Booted Out of Number 10 - UIK General Election 2024 - 4th July 24
Clown Rishi Delivers Tory Election Bloodbath, Labour 400+ Seat Landslide - 1st July 24
Bitcoin Happy Thanks Halving - Crypto's Exist Strategy - 30th June 24
Is a China-Taiwan Conflict Likely? Watch the Region's Stock Market Indexes - 30th June 24
Gold Mining Stocks Record Quarter - 30th June 24
Could Low PCE Inflation Take Gold to the Moon? - 30th June 24
UK General Election 2024 Result Forecast - 26th June 24
AI Stocks Portfolio Accumulate and Distribute - 26th June 24
Gold Stocks Reloading - 26th June 24
Gold Price Completely Unsurprising Reversal and Next Steps - 26th June 24
Inflation – How It Started And Where We Are Now - 26th June 24
Can Stock Market Bad Breadth Be Good? - 26th June 24
How to Capitalise on the Robots - 20th June 24
Bitcoin, Gold, and Copper Paint a Coherent Picture - 20th June 24
Why a Dow Stock Market Peak Will Boost Silver - 20th June 24
QI Group: Leading With Integrity and Impactful Initiatives - 20th June 24
Tesla Robo Taxis are Coming THIS YEAR! - 16th June 24
Will NVDA Crash the Market? - 16th June 24
Inflation Is Dead! Or Is It? - 16th June 24
Investors Are Forever Blowing Bubbles - 16th June 24
Stock Market Investor Sentiment - 8th June 24
S&P 494 Stocks Then & Now - 8th June 24
As Stocks Bears Begin To Hibernate, It's Now Time To Worry About A Bear Market - 8th June 24
Gold, Silver and Crypto | How Charts Look Before US Dollar Meltdown - 8th June 24
Gold & Silver Get Slammed on Positive Economic Reports - 8th June 24
Gold Summer Doldrums - 8th June 24
S&P USD Correction - 7th June 24
Israel's Smoke and Mirrors Fake War on Gaza - 7th June 24
US Banking Crisis 2024 That No One Is Paying Attention To - 7th June 24
The Fed Leads and the Market Follows? It's a Big Fat MYTH - 7th June 24
How Much Gold Is There In the World? - 7th June 24
Is There a Financial Crisis Bubbling Under the Surface? - 7th June 24

Market Oracle FREE Newsletter

How to Protect your Wealth by Investing in AI Tech Stocks

Gold GLD ETF Making a Bottom

Commodities / Gold and Silver 2011 Feb 16, 2011 - 07:11 AM GMT

By: Guy_Lerner

Commodities

The SPDR Gold Trust (symbol: GLD) is making an intermediate bottom making support and stop loss levels easily identifiable.

Figure 1 is a daily chart of the GLD. The yellow (and sometimes red and yellow) dots on the price charts represent key pivot points. Key pivot points represent the most intense zones of buying (support) and selling (resistance). A "typical" bottoming pattern would be for GLD (and most assets) to trade below a key pivot point or support level taking out stops and then reversing higher. Recent price action has GLD trading below the key pivot at 133.51.


Old support now becomes new resistance. Prices then found a bottom near the next level of support at 129.64. Prices pivoted higher and are now trading back above the nearest key pivot or resistance zone at 133.51. This "typical" price pattern was seen throughout all of 2010, and is noted on the chart by the shaded rectangles labeled 1 through 3. This is a common bottoming pattern.

Figure 1. GLD/ daily

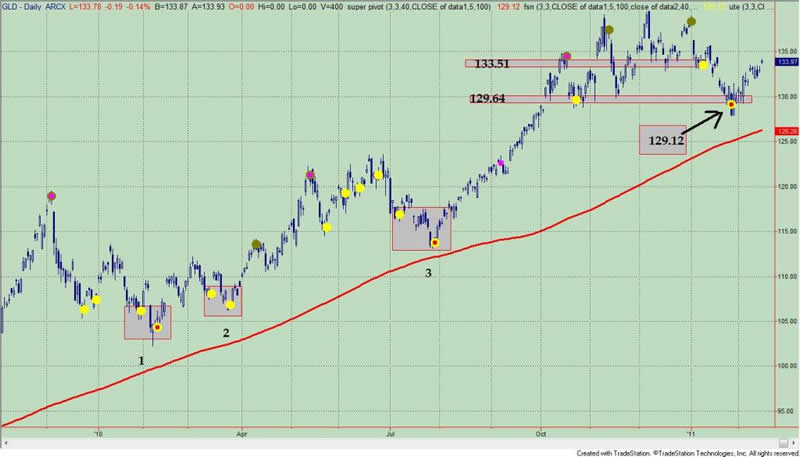
More importantly, the key pivot at 129.12 (labeled with black arrow) really becomes our "line in the sand". Trade below this level implies a much deeper correction, and this would be reason enough to move to the sidelines.

By Guy Lerner

    http://thetechnicaltakedotcom.blogspot.com/

    Guy M. Lerner, MD is the founder of ARL Advisers, LLC and managing partner of ARL Investment Partners, L.P. Dr. Lerner utilizes a research driven approach to determine those factors which lead to sustainable moves in the markets. He has developed many proprietary tools and trading models in his quest to outperform. Over the past four years, Lerner has shared his innovative approach with the readers of RealMoney.com and TheStreet.com as a featured columnist. He has been a regular guest on the Money Man Radio Show, DEX-TV, routinely published in the some of the most widely-read financial publications and has been a marquee speaker at financial seminars around the world.

    © 2011 Copyright Guy Lerner - All Rights Reserved
    Disclaimer: The above is a matter of opinion provided for general information purposes only and is not intended as investment advice. Information and analysis above are derived from sources and utilising methods believed to be reliable, but we cannot accept responsibility for any losses you may incur as a result of this analysis. Individuals should consult with their personal financial advisors.

    Guy Lerner Archive

© 2005-2022 http://www.MarketOracle.co.uk - The Market Oracle is a FREE Daily Financial Markets Analysis & Forecasting online publication.


Post Comment

Only logged in users are allowed to post comments. Register/ Log in