


Long Term U.S. Treasury Yields Heading Lower
Interest-Rates / US Bonds Feb 24, 2011 - 01:28 PM GMTBy: Guy_Lerner

 Lost in all the noise about crude oil this week and its effect on the economic recovery (i.e., the equity rally) has been the top in Treasury yields. This article will cover the technical aspects of the Ultra Short Lehman 20 plus Year Treasury Fund (symbol: TBT).
Let's start with a weekly chart (see figure 1) of the Ultra Short Lehman 20 plus Year Treasury Fund (symbol: TBT); this 2x leveraged ETF moves inverse to bond prices or in the direction of Treasury yields.
Key pivot points or areas of support (buying) and resistance (selling) are noted by the pink and black dots. The pink labeled price bars are negative divergence bars. As is seen in the gray oval, a cluster of negative divergence bars is a sign of slowing price momentum. Not all negative divergences lead to a market top, but it is the break below this range and what appears to be a likely weekly close below the key pivot at 38.44 that will seal the deal for TBT. Couple this with the failed breakout, and I believe you have a recipe for lower prices in TBT. Look for TBT to retest the lows at 31.93.
Figure 1. TBT/ weekly
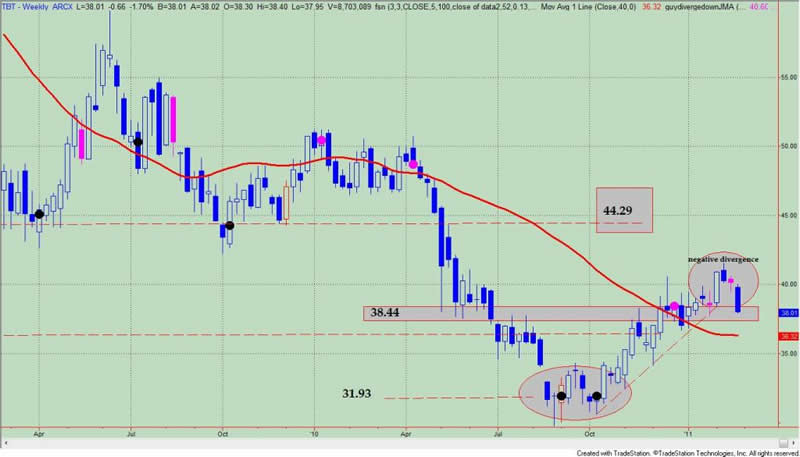
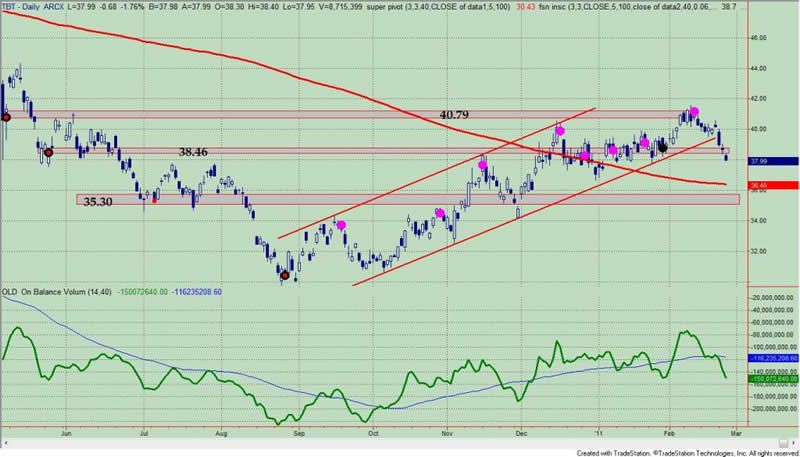
Figure 2 is a daily chart of the TBT, and we note that TBT has fallen out of the rising trend channel. The on balance volume indicator in the lower panel is leading price lower, and the 200 day moving average of price is still down sloping. Support is at 35.30, and these will likely intersect with price at the down sloping 200 day moving average. This will be the first stop on the path to lower prices in TBT.
Figure 2. TBT/ daily
In part 2 of this technical review, I will flip the picture around and look at the i - Shares Lehman 20 plus Year Treasury Fund (symbol: TLT).
By Guy Lerner
http://thetechnicaltakedotcom.blogspot.com/
Guy M. Lerner, MD is the founder of ARL Advisers, LLC and managing partner of ARL Investment Partners, L.P. Dr. Lerner utilizes a research driven approach to determine those factors which lead to sustainable moves in the markets. He has developed many proprietary tools and trading models in his quest to outperform. Over the past four years, Lerner has shared his innovative approach with the readers of RealMoney.com and TheStreet.com as a featured columnist. He has been a regular guest on the Money Man Radio Show, DEX-TV, routinely published in the some of the most widely-read financial publications and has been a marquee speaker at financial seminars around the world.
© 2011 Copyright Guy Lerner - All Rights Reserved
Disclaimer: The above is a matter of opinion provided for general information purposes only and is not intended as investment advice. Information and analysis above are derived from sources and utilising methods believed to be reliable, but we cannot accept responsibility for any losses you may incur as a result of this analysis. Individuals should consult with their personal financial advisors.
Guy Lerner Archive |
© 2005-2022 http://www.MarketOracle.co.uk - The Market Oracle is a FREE Daily Financial Markets Analysis & Forecasting online publication.